
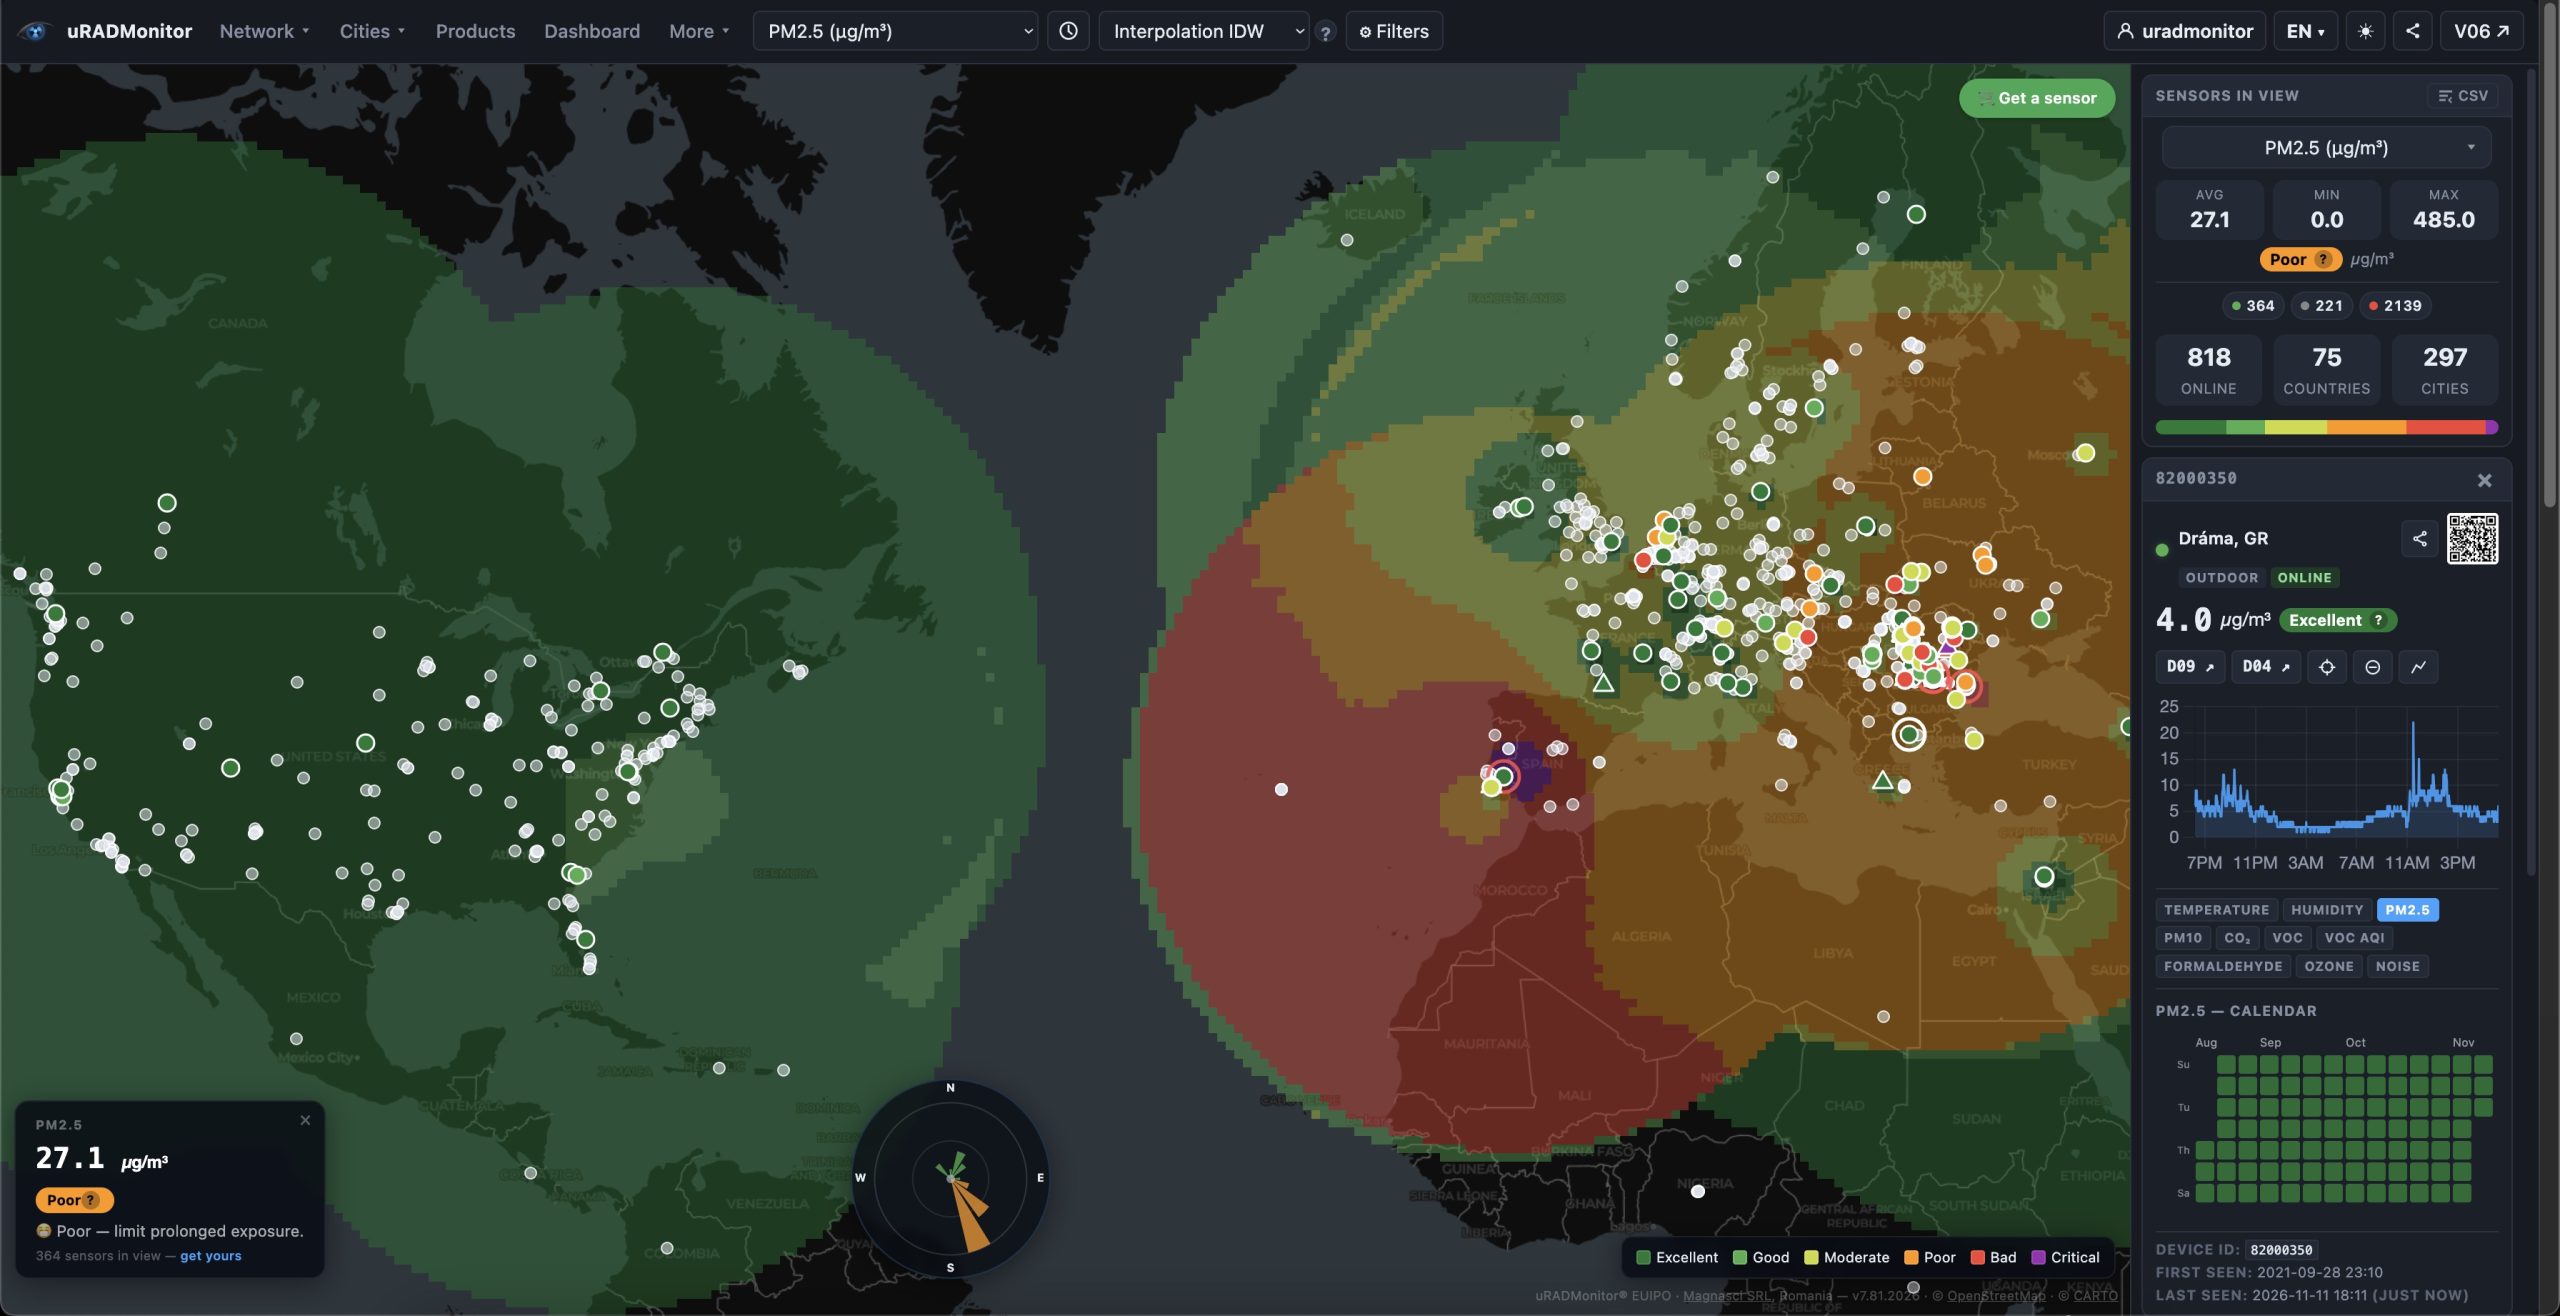
Abstract. uRADMonitor is a distributed environmental monitoring network established in 2012 that has grown to more than 4,000 internet-connected sensors worldwide. This article examines the technical, organizational and community-based mechanisms that have contributed to its development and continued operation. These include multi-parameter sensing, different device configurations and communication technologies, open-source designs, third-party data integration, academic collaborations, technical-community integrations, public-engagement activities and local data-access mechanisms. It also describes operational tools used to support network continuity, including configurable threshold alerts, automated device-health notifications, per-device service records and options for retrieving measurements directly from a device or redirecting data to a locally controlled endpoint. The article considers municipal deployments in Bistrița, Cluj-Napoca, București and Timișoara, focusing on the value of spatially distributed measurements and long-term datasets for describing local environmental conditions. It further examines data accessibility and governance, including the risk that measurements may become unavailable through changes to public-facing platforms. Using uRADMonitor as a case study, the article identifies practical considerations for Citizen Observatories seeking to maintain infrastructure, stakeholder engagement and publicly accessible environmental data beyond the lifetime of individual funded projects.
How uRADMonitor combined engineering, open-source technology, research collaboration and distributed ownership to build a long-lasting environmental monitoring infrastructure.
One recurring challenge in citizen-led environmental monitoring is maintaining a network after the initial deployment phase. When project funding ends, operating costs, maintenance responsibilities and data-platform hosting still need to be covered. Without an explicit continuity model, devices may stop reporting and previously collected time series may become difficult to access. The CitiObs community is concerned with this question of what happens after a project ends. uRADMonitor provides a case study of a network that has been developed and operated since 2012. Its development has involved several complementary technical and organizational approaches rather than reliance on a single intervention.
It started with missing data
uRADMonitor originated in response to a perceived gap in access to environmental measurements. The Fukushima Daiichi accident on 11 March 2011 brought public attention to the need for timely and accessible radiation data. For the project’s founder, the event reinforced the value of independent, continuously operating measurement devices and of making their readings publicly accessible. The technical challenge was therefore not limited to building a detector; it was to develop a system for collecting, transmitting and publishing measurements over time, in a time when IOT was not yet a buzzword.
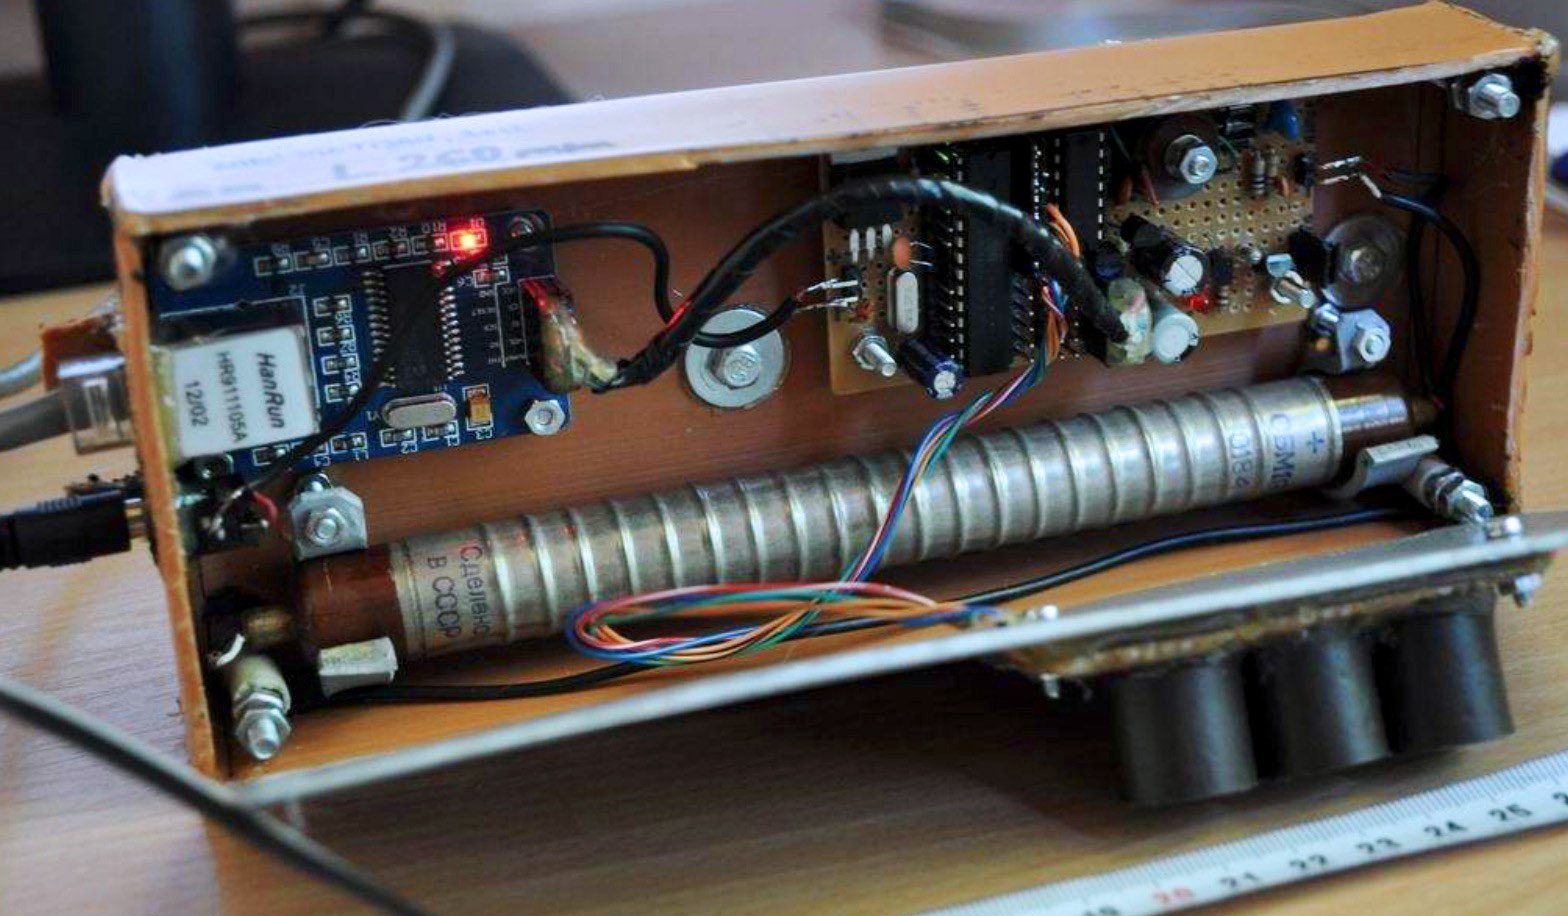
On 21 October 2012, the first prototype went live: a fixed station incorporating a Geiger-Müller tube and sensors for temperature, pressure and humidity. It connected over Ethernet and transmitted a data packet every 60 seconds to a public dashboard. The device ran open-source firmware on an AVR microcontroller with only 2 KB of RAM; its schematics and code were made publicly available. The initial design combined sensing, network connectivity and online data publication in a single device. By December 2025, the network had grown to more than 4,000 internet-connected sensors worldwide.
This origin helps explain the project’s emphasis on continuity and public access. The network was developed around the ongoing collection and publication of measurements, rather than around a single deployment milestone. Its long-term operation nevertheless depends on recurring technical work, maintenance resources and continued participation by device owners and institutional partners.
Growth came from many directions, not one
The development of a network operating over more than a decade involves several interdependent requirements. Sensor capability, deployment flexibility, connectivity, access to hardware and software designs, institutional collaboration and operator engagement address different parts of the monitoring lifecycle. The following examples describe how these elements have been combined in uRADMonitor.
- Multi-parameter measurements. A uRADMonitor MODEL A3 measures several environmental parameters, including particulate matter fractions PM1, PM2.5 and PM10, ozone, formaldehyde, carbon dioxide, volatile organic compounds (VOCs), noise, temperature, relative humidity and atmospheric pressure. Combining these measurements at one location can help identify patterns and possible relationships between environmental variables.
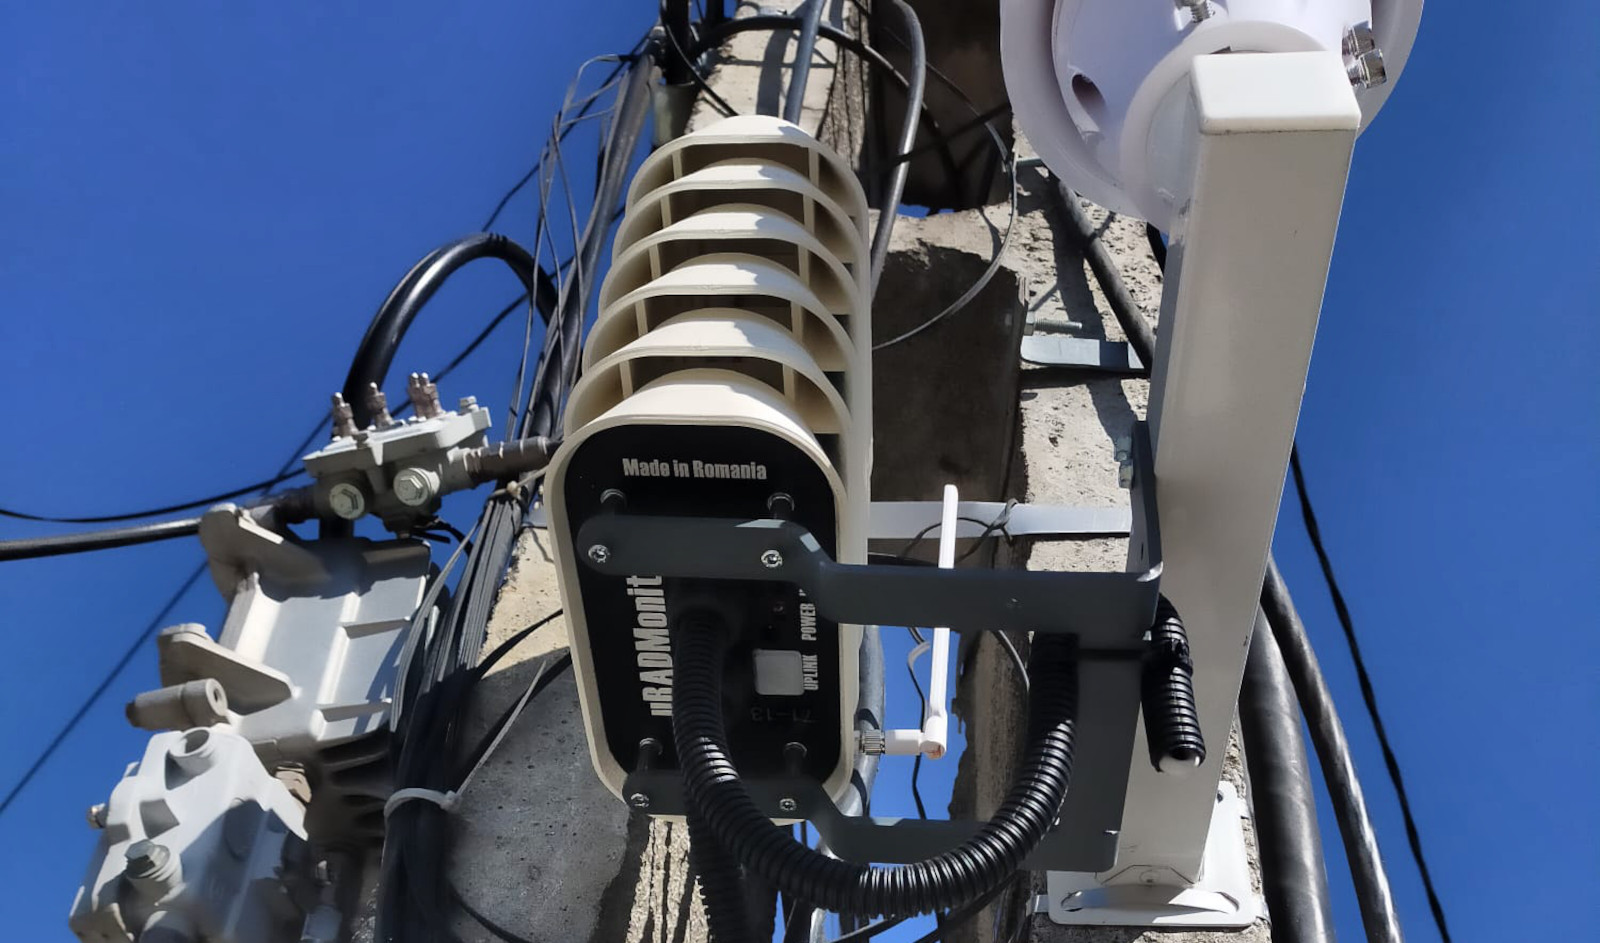
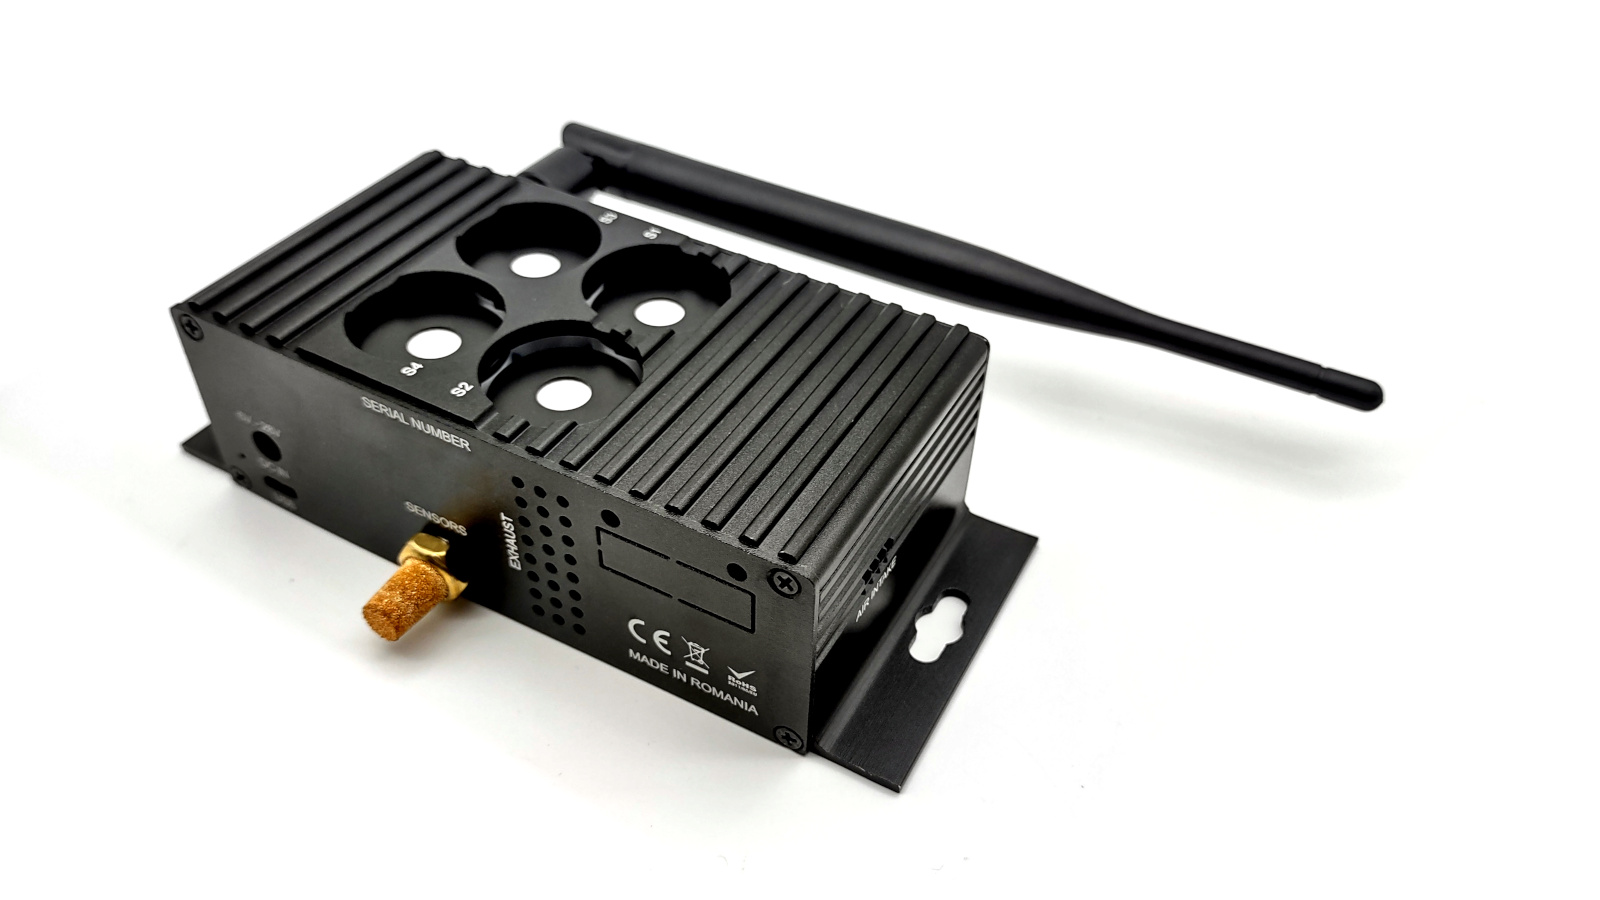
- Deployment and connectivity options. The product range includes fixed multiparameter monitoring stations (A3, A4), professional units (CITY, INDUSTRIAL), compact monitors (SMOGGIE), a portable field unit (MODEL D) and a weather station (METEO). Depending on the model, connectivity options include Ethernet with PoE, Wi-Fi, GSM, LoRaWAN, NB-IoT and LTE-M. Different configurations make it possible to address a range of deployment conditions, from indoor installations and school buildings to mobile platforms and remote sites without wired network access.
- Open-source hardware and software. Designs such as SMOGGIE and KIT1, together with the student-oriented KIT2 open-source Geiger counter, provide schematics, firmware or other design resources that can be used for learning, replication and further development. Open designs can reduce barriers to experimentation and enable contributions beyond the manufacturer’s own product range as demonstrated already.
- Third-party and DIY data sources. The network also accepts data from compatible devices that are not manufactured by uRADMonitor. The documented data-upload protocol allows developers to submit readings from custom or open-source hardware to the platform, subject to the protocol and data requirements. This extends participation beyond owners of the company’s own devices and can increase the geographic and technical diversity of contributing stations.
- Academic collaboration and independent evaluation. uRADMonitor measurements have been used in a number of published studies. Independent comparative assessments have examined the performance of specific sensor configurations for particulate matter measurements; these results should be interpreted at the level of the tested device, pollutant and test conditions, rather than as blanket validation of every unit or the entire network. uRADMonitor devices have also received recognition in international evaluations, including awards at the AIRLAB Microsensors Challenge in 2021 and a first-place result in the Outdoor Air Monitoring and Awareness category in 2023. Testing and deployment activities reported in 2025 included environments in Ghana, India and underground rail systems in France. Student participation is supported through Erasmus workshops.
- Technical communities and integrations. Integrations such as Home Assistant make measurements available in third-party software environments used by device owners. Such integrations can support local automation, visualization and continued interaction with the monitoring system.
- Direct local data access and operational autonomy. The devices are not limited to the central uRADMonitor platform. Depending on the model and interface, measurements can be retrieved locally over USB, exposed through the device’s embedded web server and JSON endpoint on a Wi-Fi or Ethernet network, or forwarded to a server selected by the operator. For supported models, changing the device endpoint allows measurements to be sent directly to a local server, without relying on the uRADMonitor data server; LoRaWAN devices can also provide payload access through the network server. These options are relevant to long-term sustainability because they allow an organisation to retain access to its measurements and integrate them into its own systems, including in deployments with restricted external connectivity or strict data-export policies. The implementation is model-dependent: endpoint redirection is documented for A3, INDUSTRIAL and CITY, while other methods have their own hardware, firmware and configuration requirements. Direct payload access may also require local decoding and configuration changes; it should therefore be understood as an architectural capability, not as a guarantee of zero-maintenance operation. See the technical documentation on Direct Data Access.
- Public engagement and artistic use. Environmental measurements can also be communicated through formats beyond maps and numerical dashboards. Artist Yuri Pattison used live sensor data in works presented at Frieze London (2016) and in the Dream Sequence installation at Dublin Port’s Pump House No. 2. In the installation, readings from two MODEL A3 units were used as inputs for a generative video and soundscape displayed on an LED wall. This is an example of environmental data being translated into an audiovisual experience for public audiences; it does not replace measurement or analysis, but offers another way to communicate it. See also the human factor.
These elements are complementary rather than interchangeable. Open hardware can support experimentation, connectivity options can widen the range of deployment sites, academic collaboration can contribute to evaluation, and operational tools can support maintenance. Their combined contribution is a more diversified development and operating model, although long-term sustainability still depends on resources, governance and continued participation.

When the directions converge: Bistrița
Bistrița provides an example of how a municipal monitoring programme can expand through successive initiatives. In 2021, the city’s “Zero Carbon City” initiative included 18 multiparameter environmental sensors deployed in schools and high-traffic areas. The European Commission’s description of that deployment identifies 10 outdoor uRADMonitor A3 units and eight indoor SMOGGIE-CO2 units. In 2026, the municipality began implementing the B-CONNECT monitoring component, which includes 15 fixed stations for urban climate and air-quality monitoring and 50 mobile stations for measurements of particulate matter, CO2, ozone and basic meteorological parameters. The project is co-funded by the European Urban Initiative. The published B-CONNECT partner list includes Babeș-Bolyai University, the University of Agricultural Sciences and Veterinary Medicine Cluj-Napoca, the Technical University of Cluj-Napoca and other organizations. These are distinct project phases and equipment categories; they should not be combined into a single count of identical sensor units. The deployment illustrates how municipal monitoring can involve different device types, locations and institutional partners.
Other deployments illustrate different uses of distributed monitoring. In Cluj-Napoca, 10 uRADMonitor A3 units were installed on public transport vehicles in 2016, allowing measurements to be collected along routes covering different parts of the city. In București, more than 100 MODEL A4 units were prepared for a major deployment in Sector 1 during 2023-2024, with over-the-air updates and a GIS dashboard intended to support the identification of local patterns and potential hotspots. In Timișoara, the distributed network has provided spatially resolved measurements and map-based views of local conditions. Changes in map colours or sensor readings between 2020 and 2024 can describe changes in the measurements displayed by the network, but they do not, on their own, establish that road rehabilitation or urban greening caused an improvement. A causal assessment would also need to account for meteorology, seasonality, changes in traffic and heating emissions, sensor configuration and data processing. Long-term datasets can contribute to policy evaluation when these factors are considered alongside the measurements.
Keeping the network alive: an automatic mechanism
Network growth does not by itself ensure operational continuity. Devices require power, connectivity, maintenance and, in some cases, replacement of consumable sensing elements. uRADMonitor uses several automated tools to monitor device status and communicate maintenance needs to owners. Three components are particularly relevant: configurable measurement alerts, automated network-health notifications and per-device service records.
- Real-time threshold alerts notify an owner when a configured measurement threshold is reached. Depending on the parameter and configuration, these alerts can draw attention to changes that may warrant checking the local conditions or the device data.
- Automated health notifications monitor device reporting status and notify owners when a unit stops sending data or appears to require attention. This can help identify interruptions earlier than relying on users to notice missing measurements on a map.
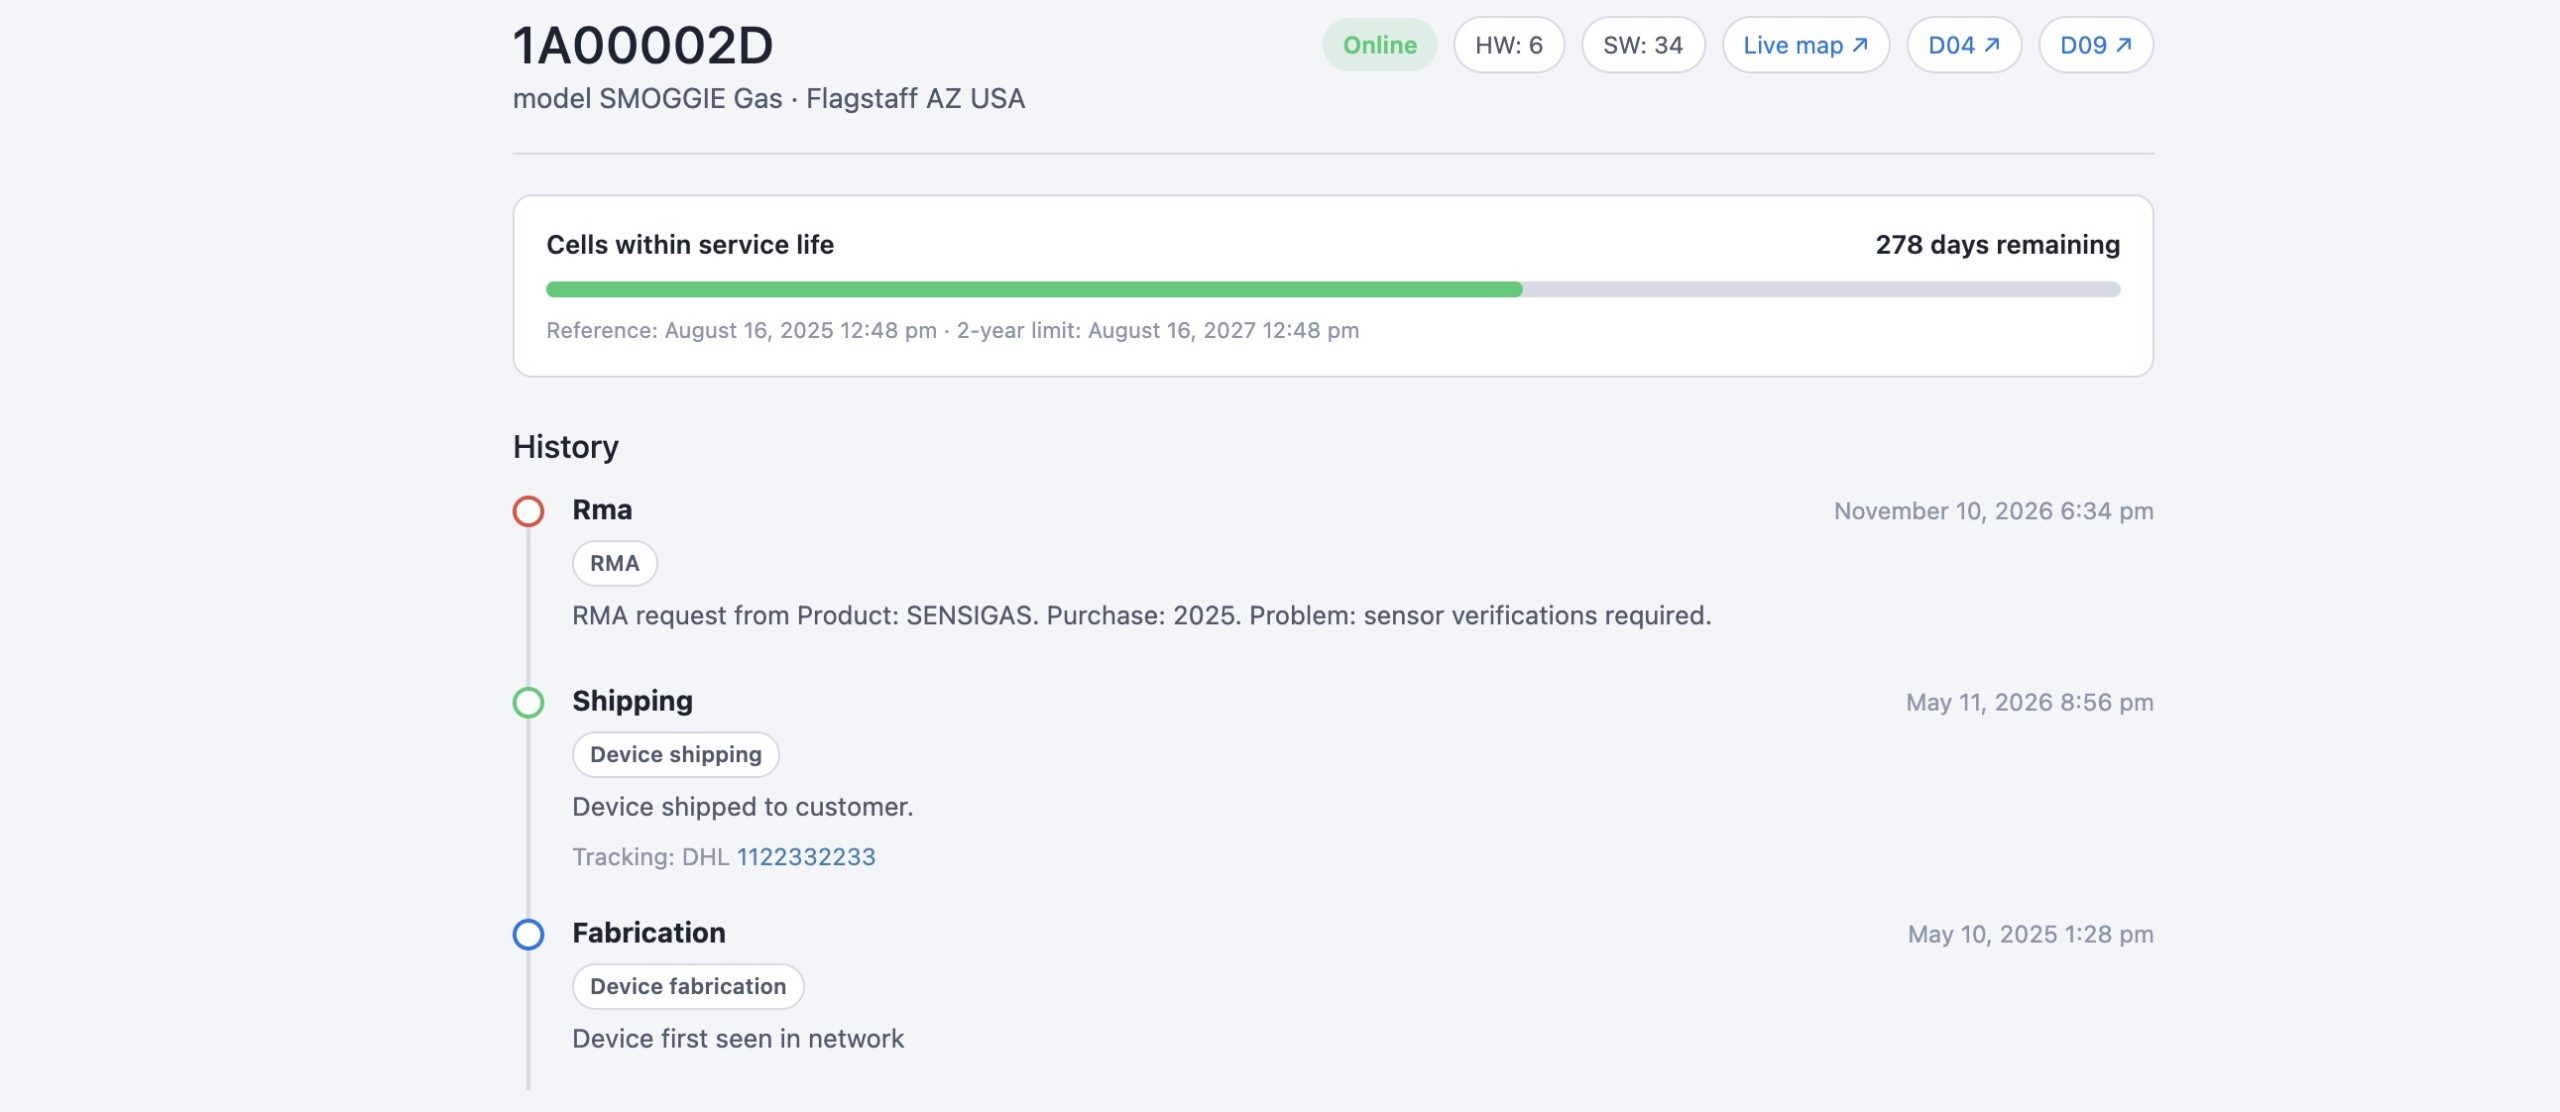
- Device Service Records provide a device-specific page documenting lifecycle events such as fabrication, testing, shipping, service and maintenance. For units equipped with electrochemical gas sensors, the record can also include a cell service counter. Electrochemical cells have a finite service life and may exhibit sensitivity drift as they age; a typical replacement interval of around two years is dependent on the sensor type and operating conditions. The counter makes accumulated service time visible and can help schedule replacement and maintenance.
These tools are intended to support owner awareness and reduce the time between a device fault and its detection. The platform is also supported by failover server infrastructure, while device reporting status is monitored across the network.
Politics: there’s data that you’d rather not see
There is a harder axis underneath all the technology. Pollution is not only a measurement problem, it is a political one, and it is lethal: according to the European Environment Agency, an estimated 14,065 premature deaths in Romania in 2023 were attributable to long-term exposure to PM2.5 concentrations above the WHO guideline level of 5 µg/m³ (95% confidence interval: 10,736–15,687). This is a population-level health-impact estimate, not a direct count of deaths in which PM2.5 was recorded as the cause. The EEA’s estimate and methodology are described in its 2025 country fact sheet. Much of the winter pollution in Romanian cities comes from heating with fossil fuels, sometimes with waste, driven by energy poverty as much as by negligence. Publishing that data assigns responsibility, and responsibility is uncomfortable, so it gets passed around endlessly and never quite lands anywhere.
Consider one real pattern, with the city left unnamed, call it city X. It had installed around a hundred sensors. In the cold season a thermal inversion settled over it, trapping pollution under a bell of still air, and the levels climbed. The city, as the direct beneficiary of the network, had real-time access to every reading on its dashboard. As the numbers rose, so did the discussion and pressure on local social-media groups. The response was not to tackle the pollution or address it in public. From the same dashboard where sensors can be shown or hidden on the public map, the administration simply hid them. Overnight, the problem “disappeared”, not because the air got cleaner, but because the sensors were switched off from public view.
This is where independent publication, direct local access and data distribution become relevant. Air-quality information is directly relevant to public health and environmental decision-making. Public access should therefore not depend exclusively on a single dashboard or interface. uRADMonitor devices provide several local access paths, depending on model and configuration: a USB serial interface can return the latest available measurement; Wi-Fi and Ethernet models expose a local web page and a JSON endpoint on the device; and supported models can be configured to send their data to an endpoint chosen by the operator. In the latter configuration, a local server can receive the device data without depending on the central uRADMonitor data server. This is particularly relevant to organisations that require data to remain inside a closed network or that want to preserve local collection if a central service becomes unavailable. Some configurations require additional setup, local payload decoding or changes to watchdog and encryption settings, and the available methods vary by device. Local access therefore improves technical independence, but does not remove the need for local power, network infrastructure, software maintenance and data storage.
Where measurements are also shared with external platforms such as OpenAQ and discussed in independent monitoring communities such as Local Haze, additional copies and access routes can improve data availability. Such distribution does not guarantee that every dataset will remain permanently accessible, but it reduces dependence on a single publication channel and makes unilateral removal from one interface less likely to erase all public access. The available local methods are described in the Direct Data Access documentation.
Uniform Data, Uniform Rights
The “Uniform Data, Uniform Rights” campaign, conducted successfully through Indiegogo, sought to extend environmental monitoring to locations where monitoring infrastructure and publicly accessible data were limited. The campaign’s contribution model offered a backer two MODEL A3 sensors: one for the backer and one donated to a location selected for deployment, including areas affected by traffic, diesel generators or industrial activity. Several dozen sensors were ultimately supplied to a university in Brazil for a local deployment. The campaign had a limited reach in terms of the total number of devices deployed, but it demonstrated one working approach to linking individual contributions with monitoring capacity in under-resourced locations. Its underlying principle was that access to environmental information should not depend on a community’s economic resources or geographic location.
Measurement scope and limitations
Distributed sensor networks provide spatial and temporal information that may be difficult to obtain from a small number of fixed monitoring stations. Their measurements nevertheless need to be interpreted in relation to the intended use, sensor characteristics, deployment conditions and data-quality procedures. The European Commission’s Joint Research Centre recommends assessing sensor performance against reference measurements and applying appropriate verification, quality assurance and quality control procedures. The World Meteorological Organization similarly describes low-cost sensor networks as a complementary source of information that should be integrated with other observations and whose data should be verified. See the JRC guidance on low-cost sensor deployment for non-experts and the WMO publication on integrating low-cost sensor systems and networks.
Unless equivalence with the applicable reference method has been demonstrated for the relevant pollutant and measurement configuration, distributed sensor readings should not be presented as interchangeable with regulatory reference measurements. Their principal value may instead lie in identifying spatial patterns, supporting local investigations, informing community engagement and complementing official monitoring. Long-term comparisons also require consistent data processing and consideration of meteorology, seasonality, sensor ageing, maintenance events and changes in the network itself. These limitations do not remove the value of distributed monitoring; they define the conditions under which its data can be interpreted responsibly.
What a Citizen Observatory can take from this
uRADMonitor illustrates how a distributed environmental monitoring network can develop through incremental engineering and sustained work across several technical and organizational areas. For Citizen Observatories approaching the end of a grant, the case suggests that continuity should be addressed during system design rather than treated as a later operational concern. Relevant considerations include maintaining control over essential parts of the technical stack; avoiding dependence on a single device type, connectivity provider or publication channel; providing direct local access to device measurements and, where supported, the ability to redirect data to infrastructure controlled by the operator; documenting maintenance and data-quality procedures; providing tools that help operators identify device faults; involving research institutions and technical communities; and planning for recurring operating costs. Open data can support transparency, but public availability also depends on governance, platform operation and durable data storage. The practical objective is to preserve useful measurements and access to them beyond the funding period that enabled the initial deployment.
This is the operational experience uRADMonitor brings to the discussion about long-term continuity in Citizen Observatories. The case is not a universal template, but it provides concrete examples of technical and organizational choices that can be evaluated and adapted in other monitoring initiatives.
Liked this? Get monthly air quality findings.
One email a month from the uRADMonitor network. Unsubscribe anytime.
codemore code
~~~~