
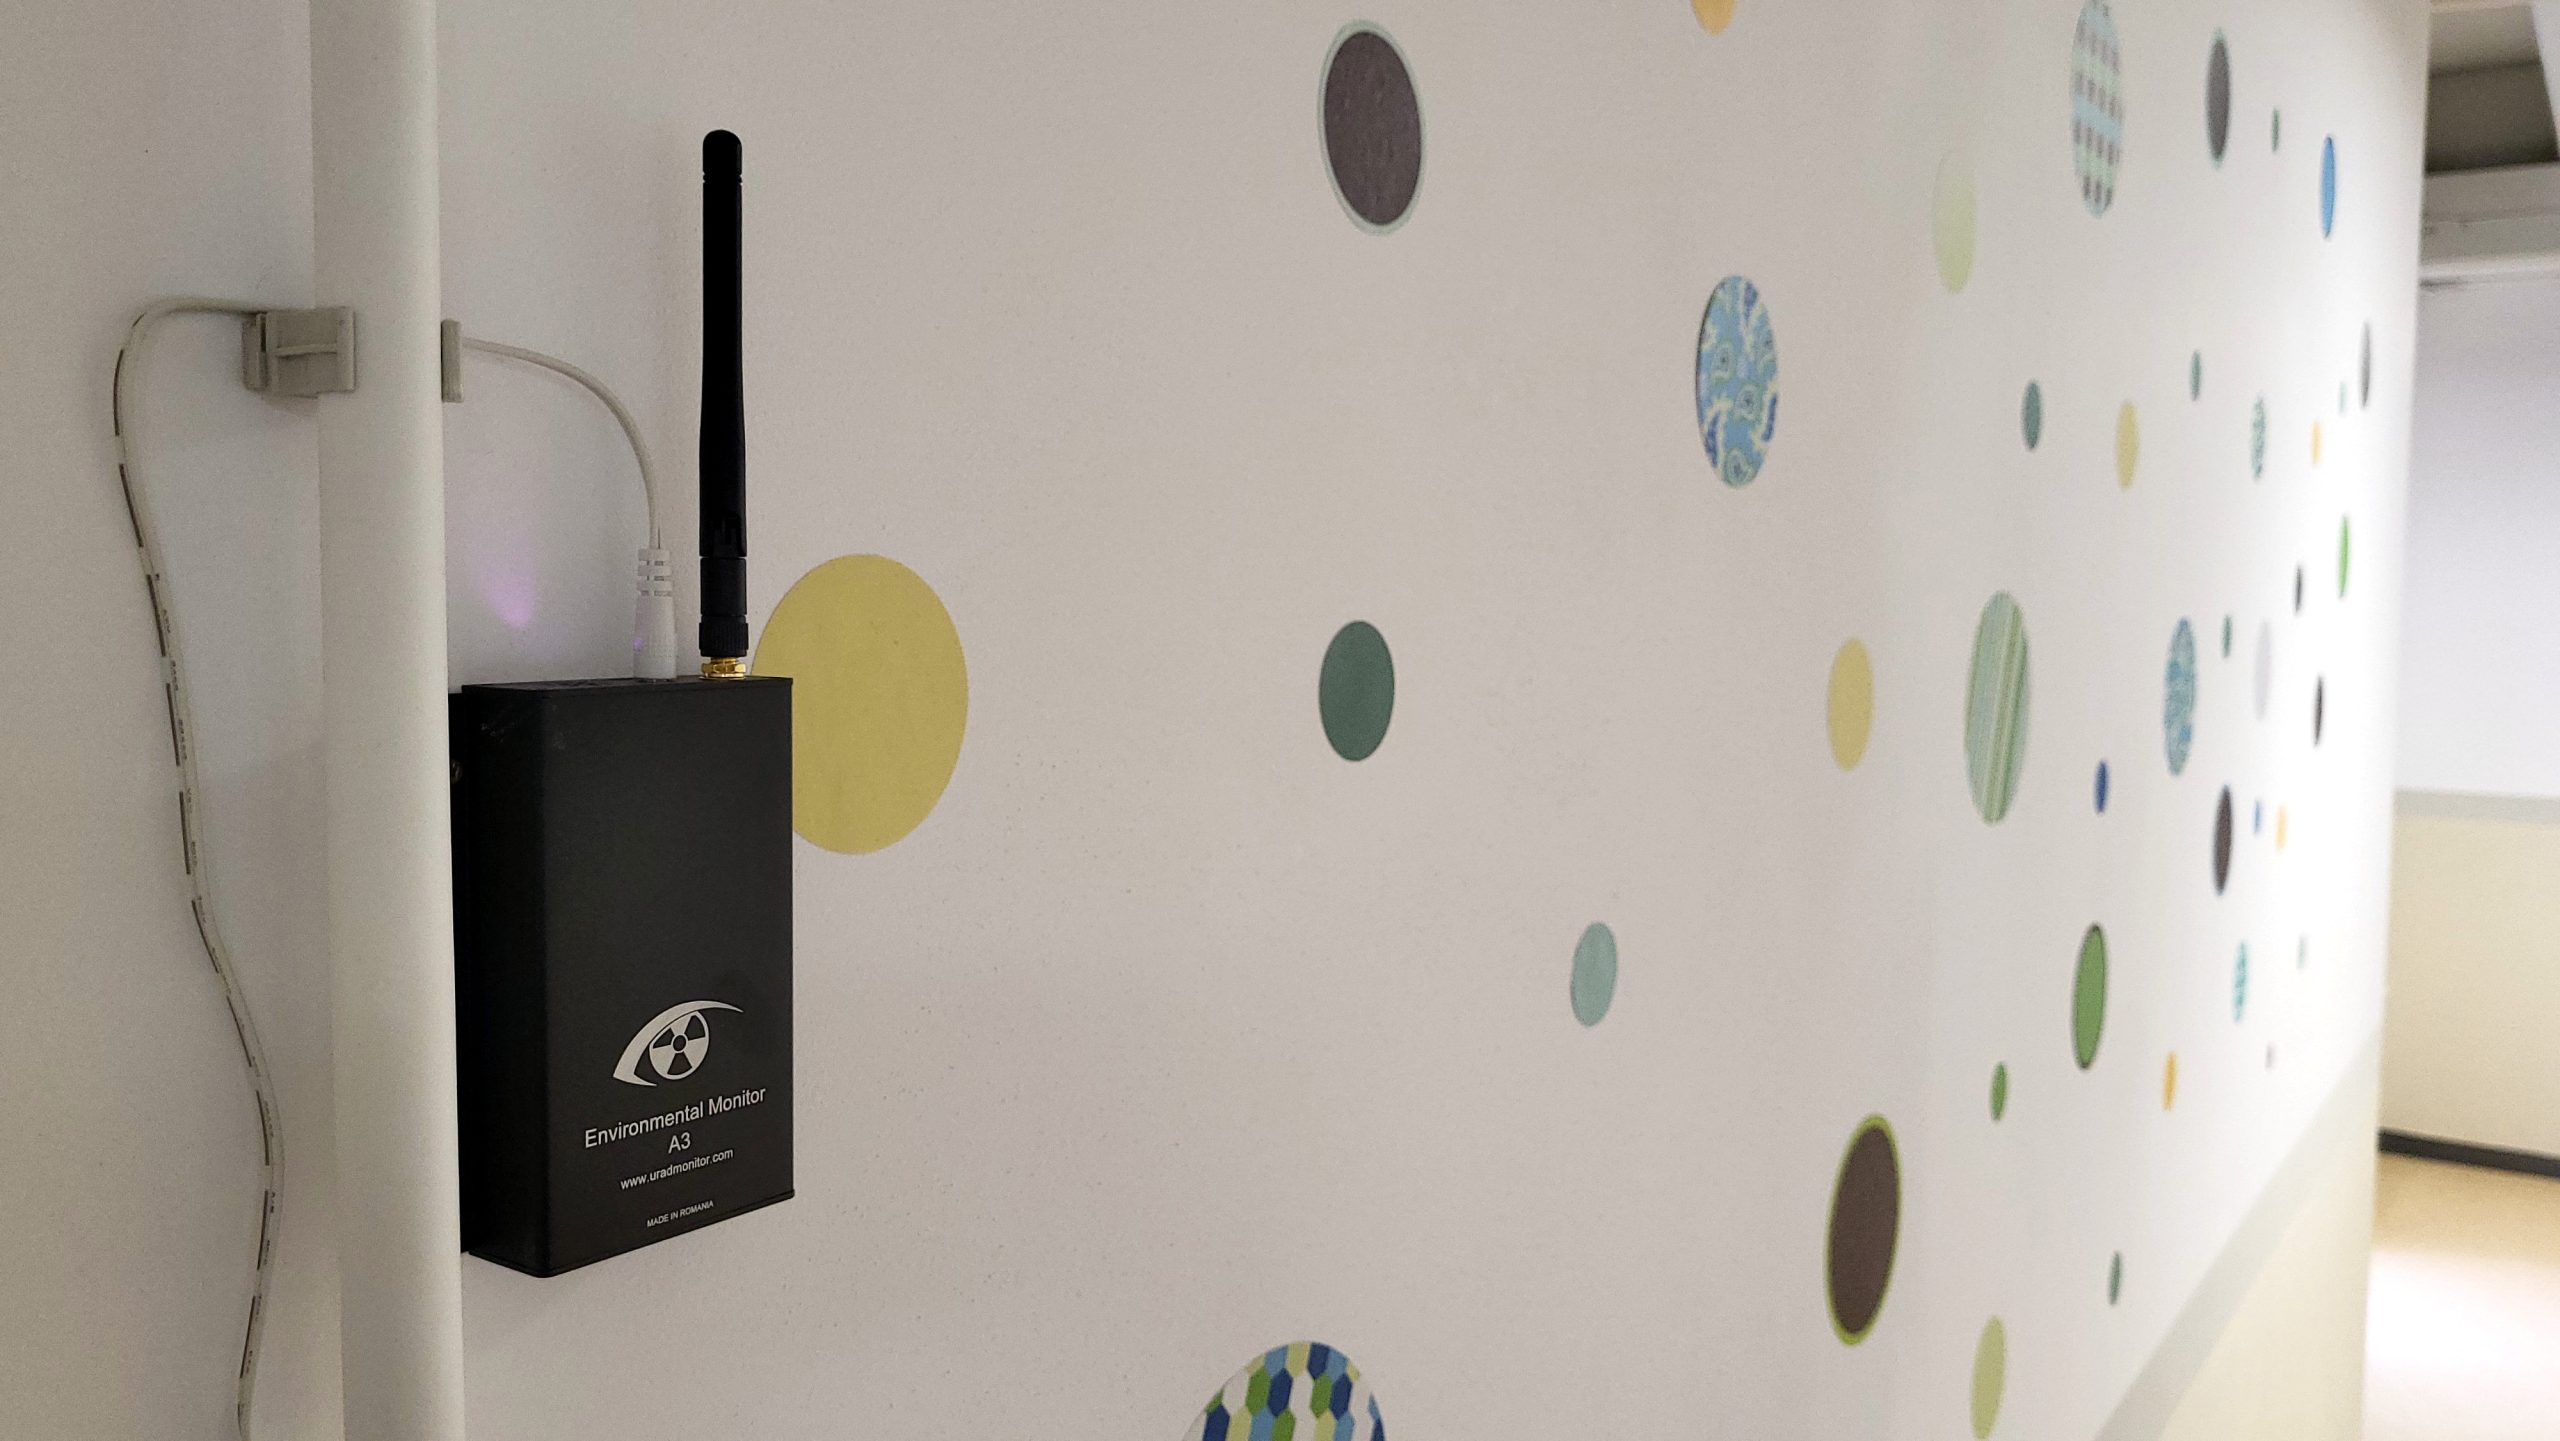
At Școala Gimnazială Dumbrăvița, Timiș County, two uRADMonitor MODEL A3 stations have been running since December 2025 in the “Casa Albă” building on Creației street. One is in the entrance hall and serves as a reference for the building. The other is in the classroom of the 3rd grade, class F. Every three minutes, each station records particulate matter (PM1, PM2.5, PM10), CO₂, ozone, formaldehyde, volatile organic compounds (VOC), noise, temperature, humidity and pressure.
This is the setup that Romanian green school projects ask for. The green schools methodology (Ministerial Order 4147/2022, art. 27(b)) requires a centralised system that monitors air quality and thermal comfort in occupied rooms and at building level, through a network of sensors. In renovation tenders it appears as the “integrated environmental monitoring equipment” line in the F5 technical form. This article looks at what such a system actually records in a working school, using about 155,000 readings collected between December 2025 and June 2026.
Why two stations
One sensor gives you numbers. Two sensors give you a comparison. The entrance hall is a large space that everyone passes through, and its door opens all day, so it shows the building’s baseline. The classroom shows what happens when a full class spends a day in one room. The difference between the two is the effect of occupancy and ventilation, and that is the part a school can change.
A school day, minute by minute
The data reads like a timetable. The chart below shows a typical day, Tuesday 12 May 2026.
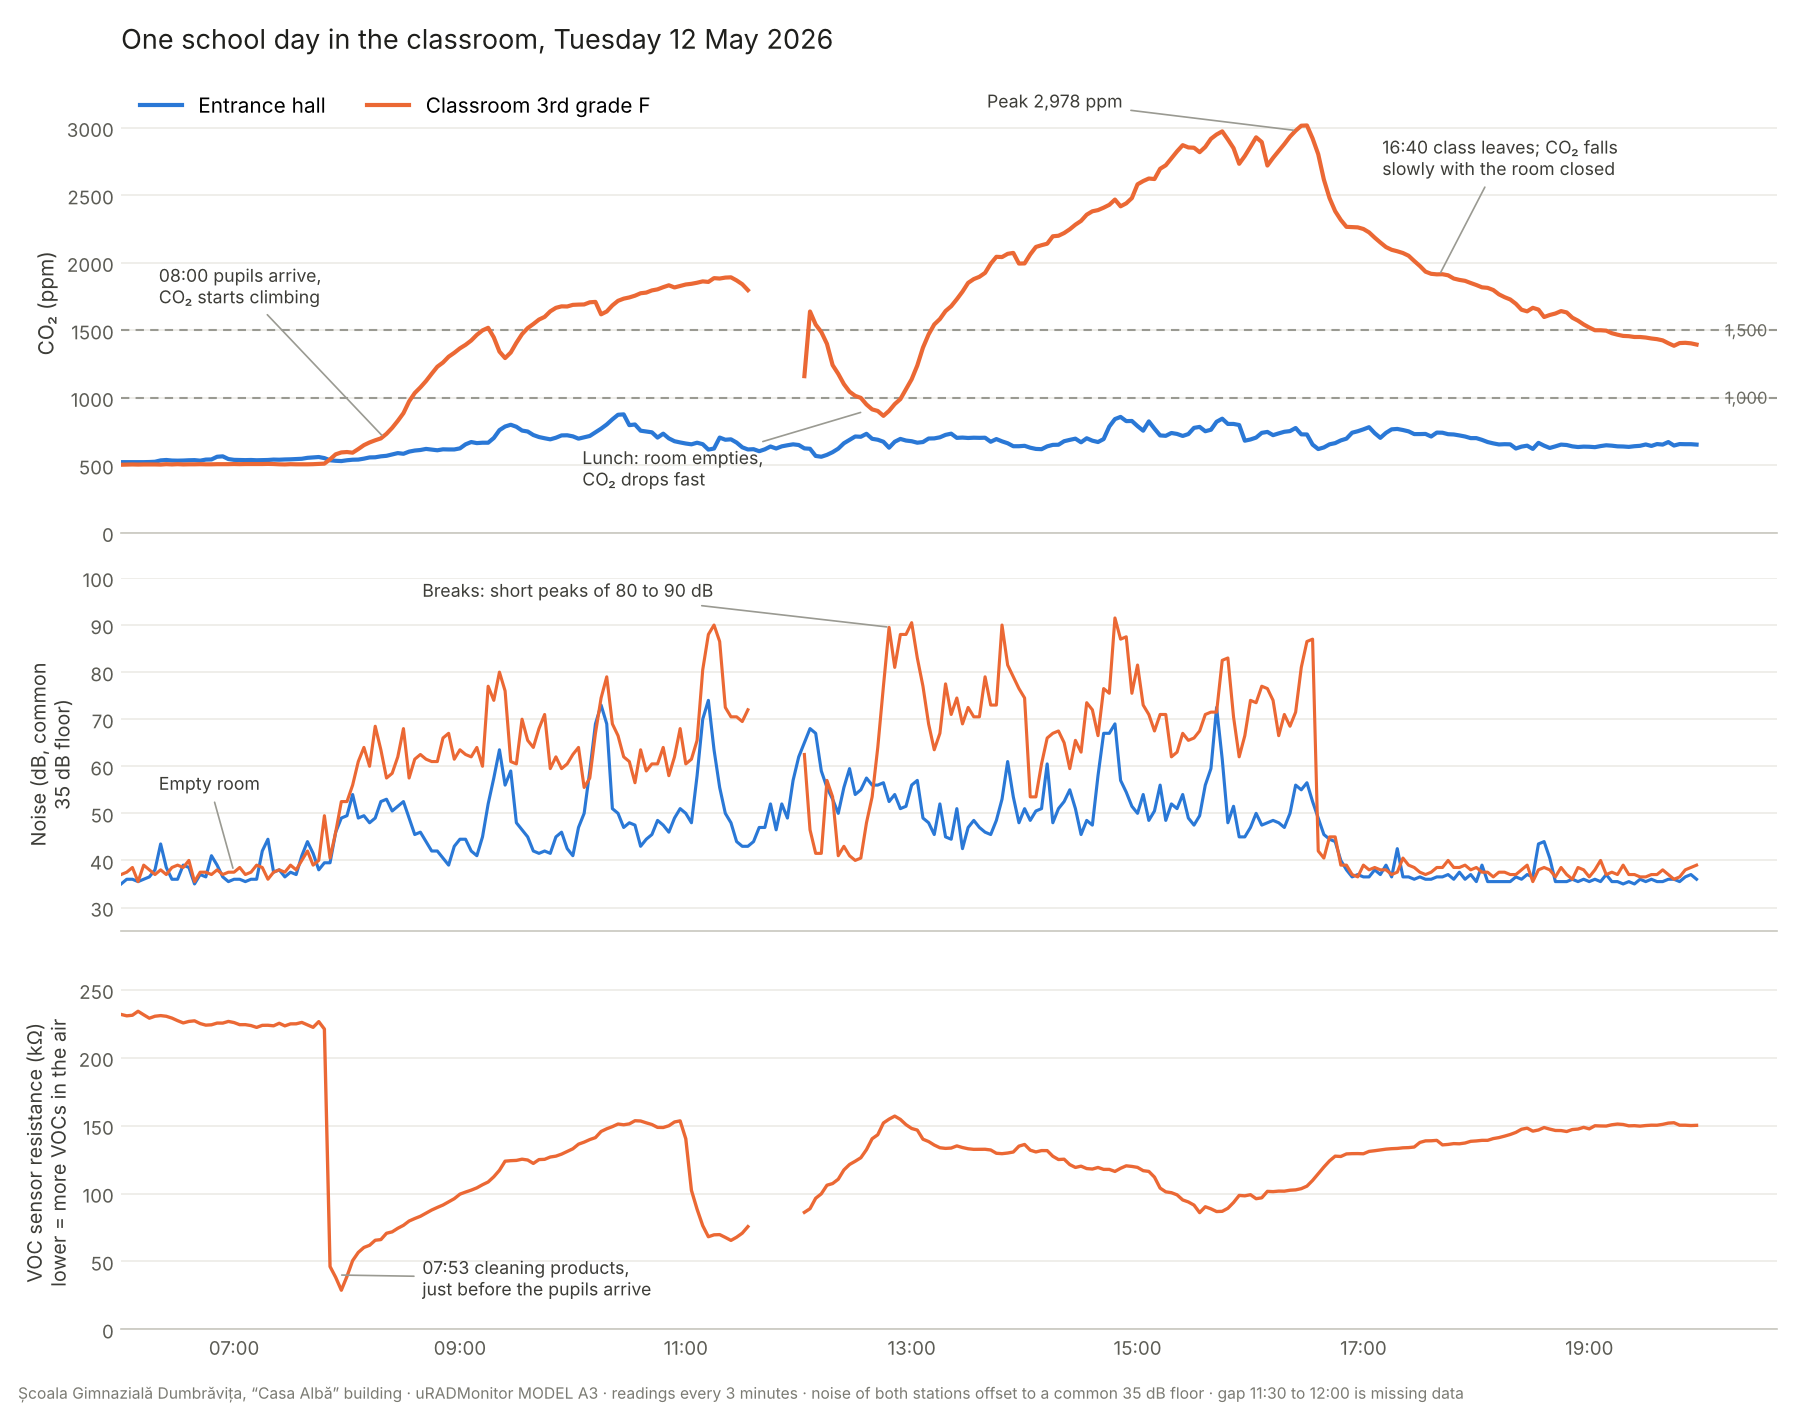
- Before 08:00 the classroom is empty: CO₂ near 510 ppm, noise around 37 dB.
- At 07:53 the VOC sensor’s resistance falls from 225 kΩ to 46 kΩ within minutes. Nobody is in the room yet, so this is cleaning: the products release volatile compounds into the air. The pupils arrive minutes later, while the sensor is still well below its morning value.
- From 08:00 noise rises and CO₂ starts to climb. It passes 1,000 ppm by 08:40 and 1,500 ppm around 09:15.
- Every break appears as a short noise peak of 80 to 90 dB in the classroom, about 20 dB above the level during lessons.
- Around lunchtime the room empties for about half an hour. CO₂ drops from about 1,600 to 900 ppm in roughly 40 minutes, which shows the room is being aired. This short window shows how much ventilation can achieve.
- In the afternoon the class is back and CO₂ climbs without a break, to a peak of 2,978 ppm at 16:25.
- At 16:40 the class leaves: noise falls to the floor at once. CO₂ falls slowly, still above 1,400 ppm at 20:00, because the room is closed. The air the pupils breathed in the afternoon stays in the room overnight.
The entrance hall, in blue, rarely passes 900 ppm on the same day.
Over the school year
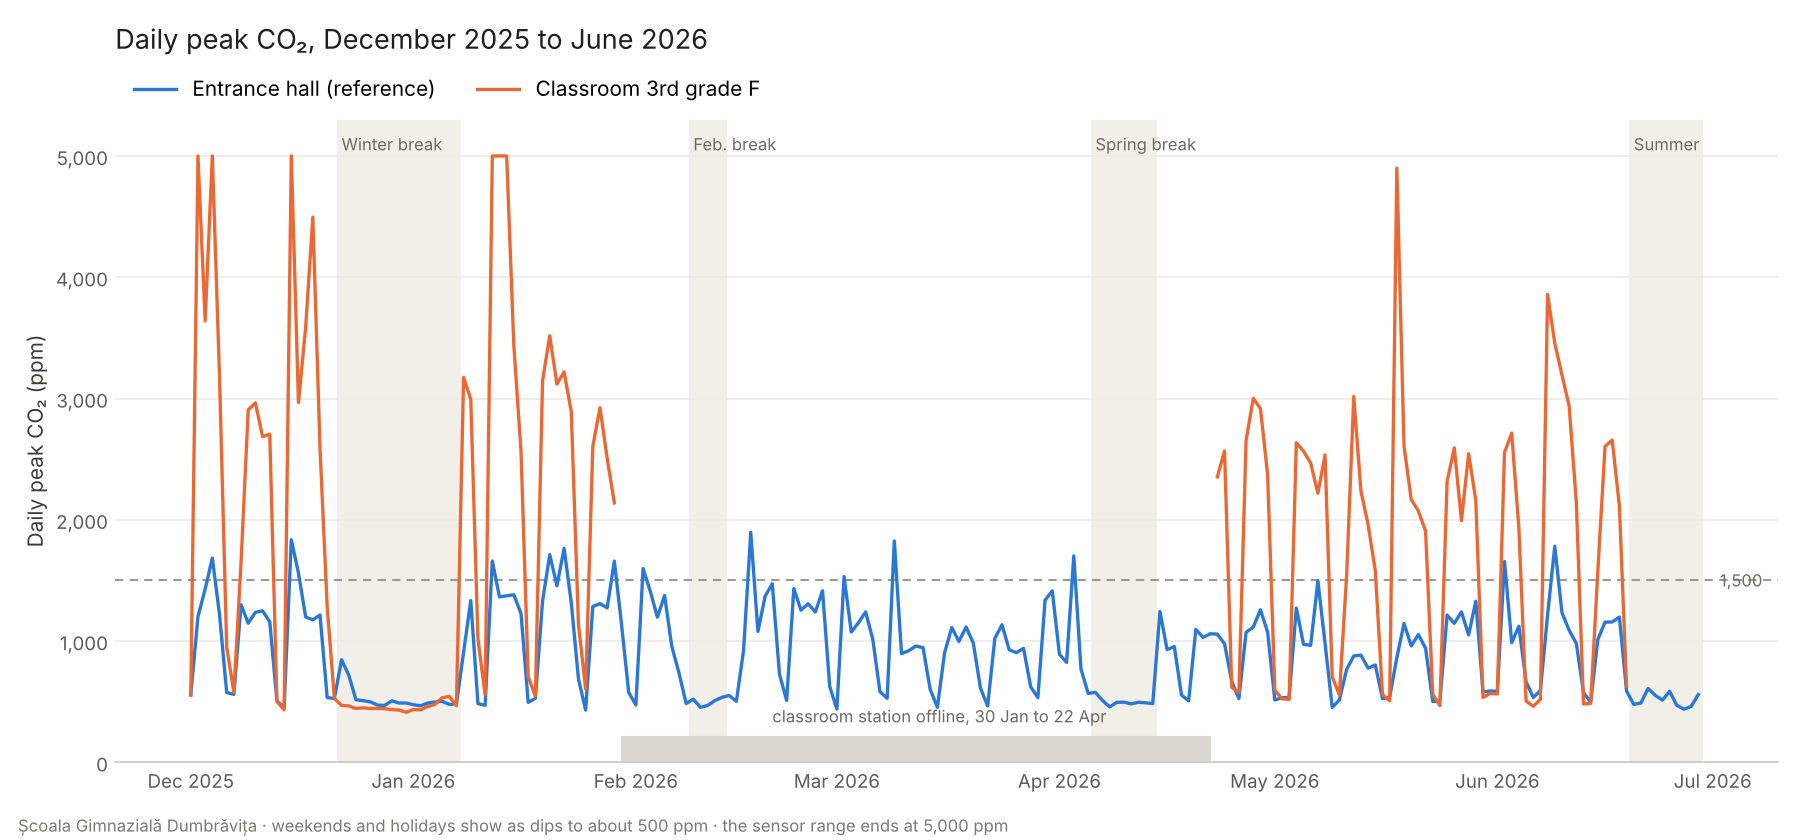
The school calendar is clearly visible. Weekends, the winter break (22 December to 7 January), the February break (9 to 13 February), the spring break (6 to 14 April), public holidays such as 1 December, 1 May and 1 June, and the start of the summer holiday after 19 June all appear as flat days around 500 ppm in both rooms. The classroom station was offline between 30 January and 22 April (a teacher took out the power adapter , like it often happens) , so the classroom figures below cover 69 school days with data: 30 in winter and 39 in spring.
| During lesson hours (08:00 to 16:30) | Classroom, winter (Dec to Jan) | Classroom, spring (Apr to Jun) | Entrance hall (118 school days) |
|---|---|---|---|
| Median CO₂ | 2,290 ppm | 1,610 ppm | 690 ppm |
| Share of lesson time above 1,500 ppm | 83 % | 58 % | under 1 % |
| Share of lesson time above 2,000 ppm | 63 % | 25 % | none |
| Typical time above 1,500 ppm per day | about 7 hours | about 5 hours | none |
| Median daily peak | 3,130 ppm | 2,540 ppm | 1,160 ppm |
| Days reaching the sensor limit of 5,000 ppm | 5 | 0 | 0 |
| Median temperature, humidity | 19.7 °C, 53 % | 22.3 °C, 48 % | 20.0 °C, 44 % |
CO₂ is the main finding. Outdoor air holds around 420 ppm. Indoors, CO₂ comes almost entirely from people breathing, so it measures how well a room is ventilated for the number of people in it. Above 1,000 ppm, fresh air is not keeping up. Laboratory studies have measured lower decision-making performance at concentrations between 1,000 and 2,500 ppm. In this classroom, CO₂ stayed above 1,500 ppm for most of the lesson time in winter and more than half of it in spring. On five winter days it reached 5,000 ppm, the top of the sensor’s range, so the true peak may have been higher.
Winter is worse, and the reason is easy to see. When it is cold outside, windows stay closed to keep the room warm. The classroom was 2.6 °C cooler in winter than in spring and its CO₂ much higher. This is the trade-off that mechanical ventilation with heat recovery solves, and why green school renovations include it. A monitoring network then shows whether the installed ventilation actually works.
The two stations agree when the building is empty. At weekends and on holidays both read about 500 ppm, close to outdoor air. This confirms that the classroom values come from occupancy and ventilation, not from a sensor offset.
Particulate matter is low. During lesson hours PM2.5 stayed around 4 µg/m³ in the classroom, below the World Health Organization’s 24-hour guideline of 15 µg/m³. For this building, outdoor smoke and dust are not the problem. Ventilation is.
Noise: the breaks you can hear in the data
The MODEL A3 measures noise with an analogue microphone. The lowest level equals 35 dB, the level the World Health Organization recommends as the background for an empty classroom. The differences between lessons, breaks and empty periods are measured directly.
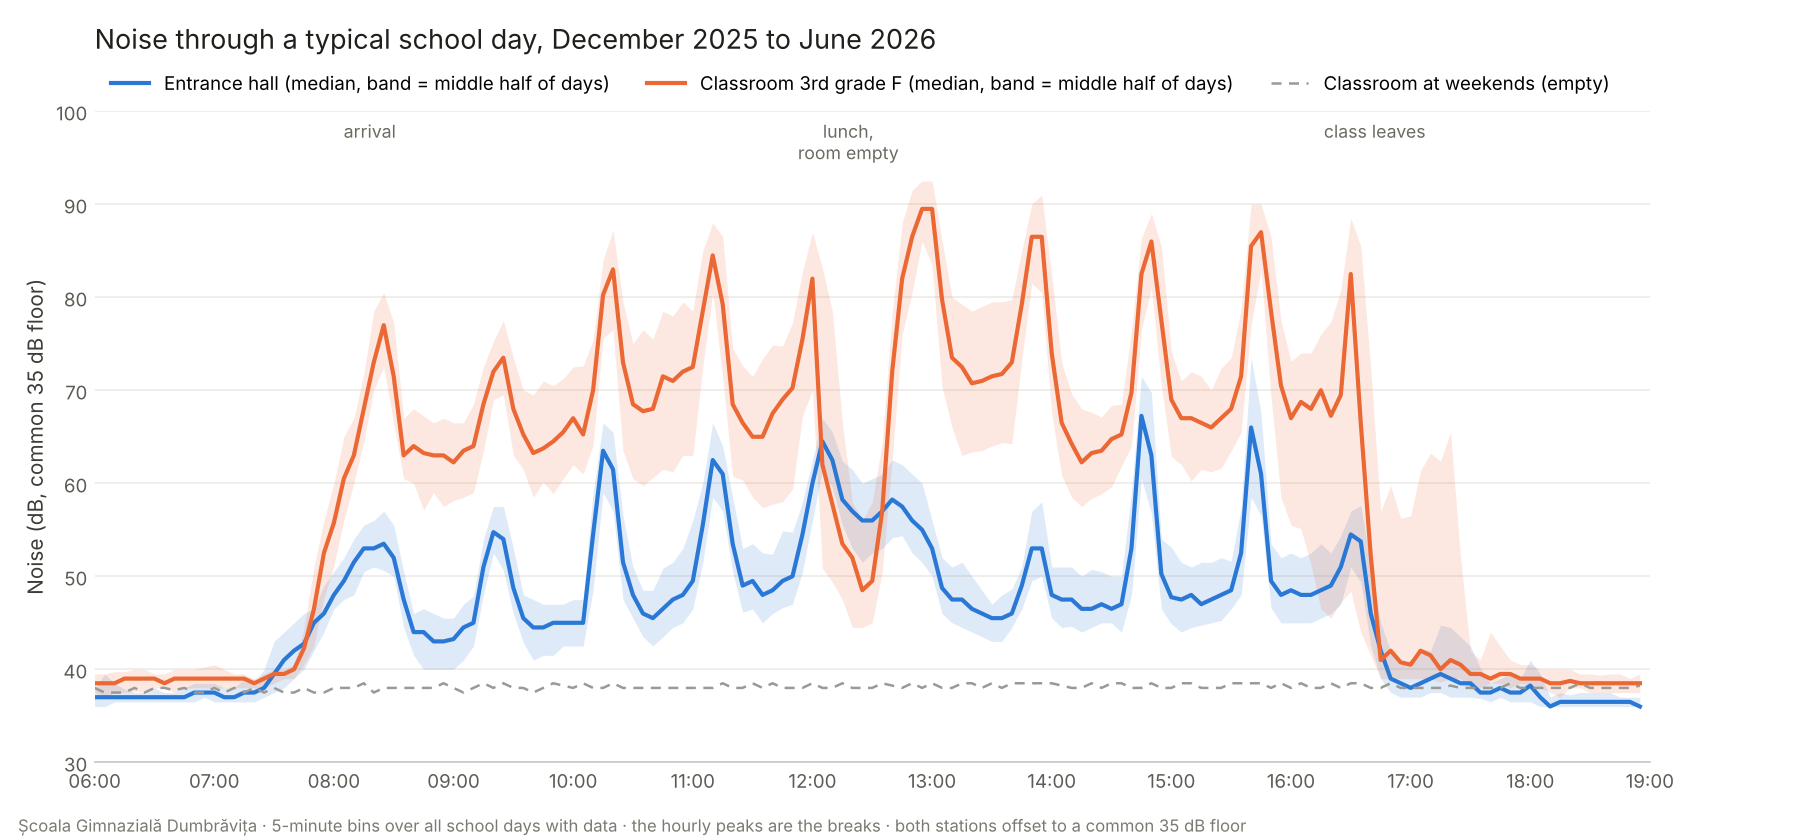
So what do we see?
- Empty building, at night and at weekends: about 36 to 38 dB in both rooms.
- Classroom during lesson hours: median 69 dB. 46 % of lesson time is above 70 dB and 20 % above 80 dB.
- Breaks: short peaks of 80 to 90 dB in the classroom, about 20 dB above the level during lessons. Each 10 dB is roughly a doubling of perceived loudness, so a break sounds about four times as loud as a lesson.
- Entrance hall during lesson hours: median 50 dB, with peaks at every break. Only 3 % of readings exceed 70 dB.
For comparison, studies of occupied primary classrooms commonly report 55 to 75 dB(A) during lessons, so these values are in the expected range for a lively class of young children. The pattern is what matters: the classroom, not the hall, is where the pupils spend their day at 70 dB and more.
For a school, the noise data answers practical questions. Which breaks are the loudest? Is the noise inside the classroom higher than in the corridors? Did acoustic panels or new windows installed during a renovation make a measurable difference?
Cleaning products, seen by the VOC sensor
The MODEL A3 measures volatile organic compounds with a metal-oxide (MOX) sensor. Its resistance falls when VOCs are present in the air, so lower values mean more pollution. The sensor does not identify individual compounds, but it reliably shows when something changes.
We looked for sudden drops of at least 30 % within 15 minutes while the classroom was empty, with noise at the floor. They appeared on 33 of the 69 school days. Most happened early in the morning, between 05:20 and 08:10, or in the evening, between 17:00 and 18:45. That is when the room is cleaned. The typical drop was 35 %, the deepest was 80 %, and the air took about 40 minutes to return to its previous level.
The timing matters. When the room is cleaned in the evening, the air clears overnight. When it is cleaned just before 08:00, as happened on several days in May, the pupils walk into air that is still loaded with the products’ compounds. Moving cleaning to the end of the day, or airing the room for half an hour afterwards, is a simple change that costs nothing. The sensor then shows whether it worked.
How much fresh air does the classroom get?
The CO₂ data also shows how fast the air in the room is replaced. When the pupils leave, CO₂ falls exponentially towards the outdoor level. The speed of that fall is the number of air changes per hour. This is the tracer gas decay method (ASTM D6245), with the pupils’ own breath as the tracer.
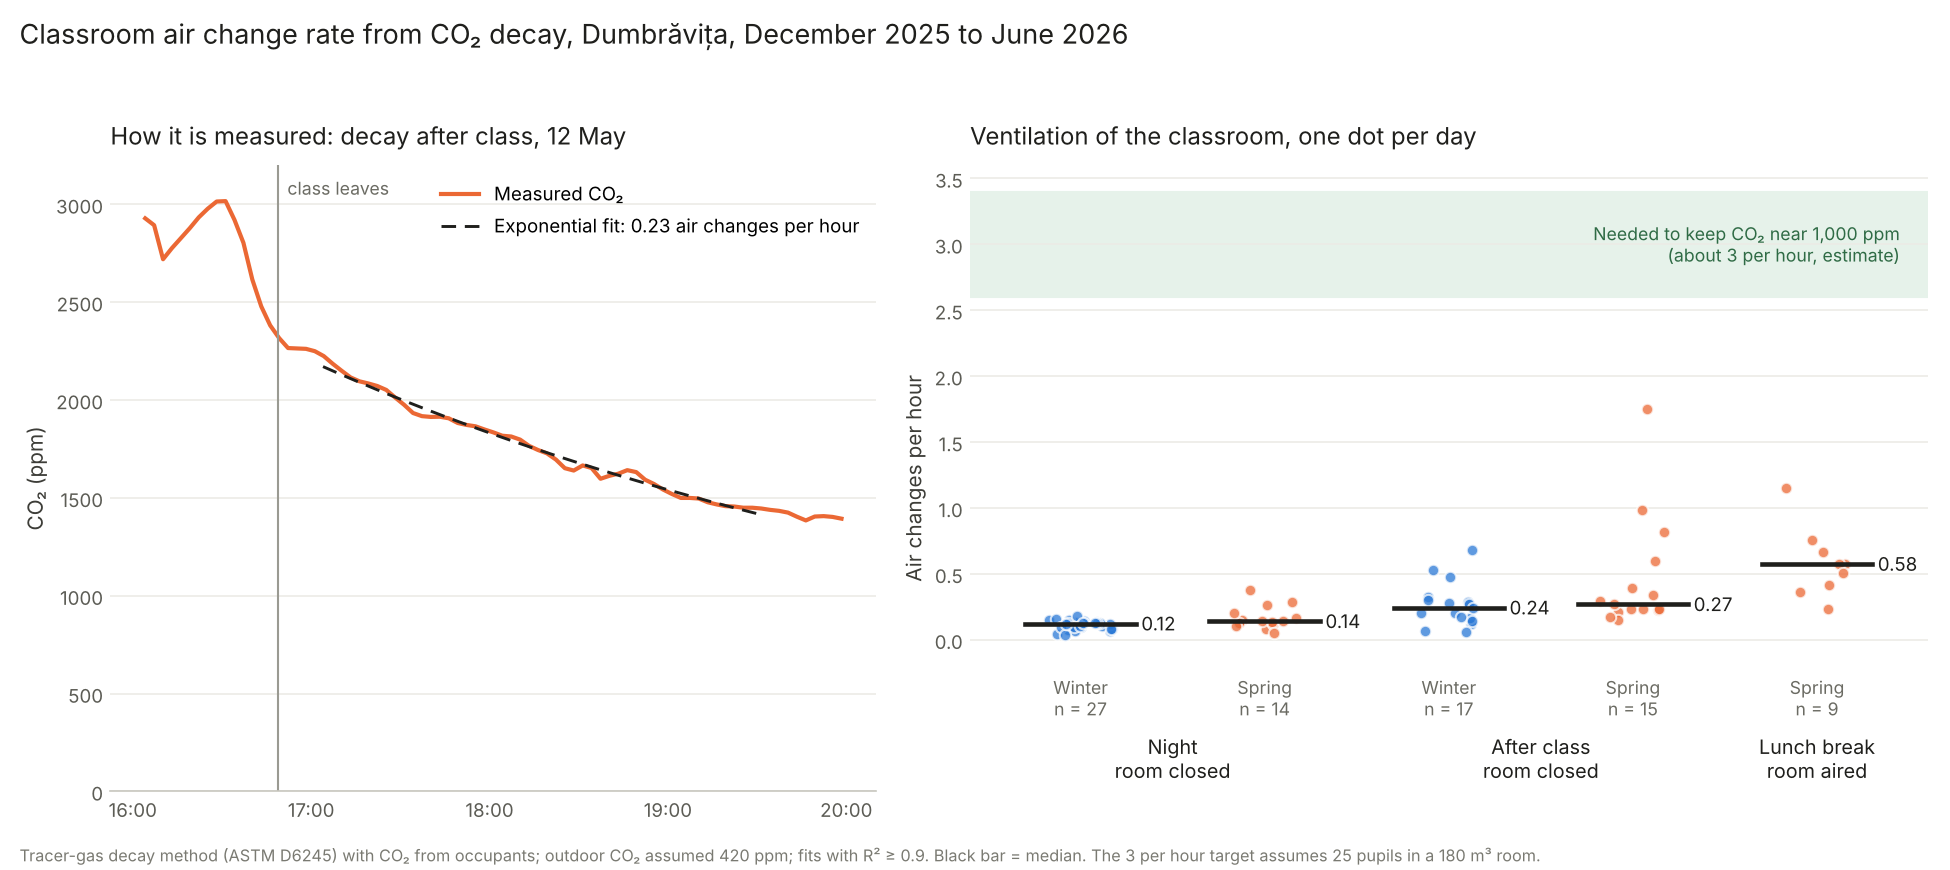
We fitted this curve on every school day with data, in three situations when the room was empty. 83 of the 128 intervals gave a clean fit (R² of at least 0.9). The medians:
- At night, room closed: 0.12 air changes per hour in winter, 0.14 in spring.
- After class, room closed: 0.24 in winter, 0.27 in spring.
- Lunch break, room aired (spring): 0.58, with a maximum of 1.16.
With the room closed, the air is replaced about once every four to eight hours. This is why the afternoon CO₂ is still in the classroom the next morning. Airing at lunch doubles or triples the ventilation, but it is still far below what the room needs. To keep CO₂ near 1,000 ppm, a class of about 25 pupils in a 180 m³ room needs around 3 air changes per hour, roughly ten times the closed-room value. The result barely depends on the assumed outdoor CO₂: changing it from 380 to 460 ppm moves the value by about 3 %.
This is the number that matters for a renovation. Opening the windows helps, but it cannot reach 3 air changes per hour in winter without cooling the room. Mechanical ventilation with heat recovery can. The same sensors will show whether it does.
Notes: the 3 air changes per hour target is an estimate based on 25 pupils and a 180 m³ room. Lunch values come from 9 spring days only, because in winter the room was rarely empty at lunch. A few high values after class are probably days when a window was opened after the pupils left.
From data to alerts
Data on a dashboard only helps if someone looks at it at the right moment. Every uRADMonitor account now includes real-time threshold alerts (in Romanian on cerespir.ro). You choose a station, a parameter, a direction and a value. Each reading is checked as it reaches the server, and the email arrives within about five minutes of the crossing. A cooldown, six hours by default, prevents repeated messages for the same episode.
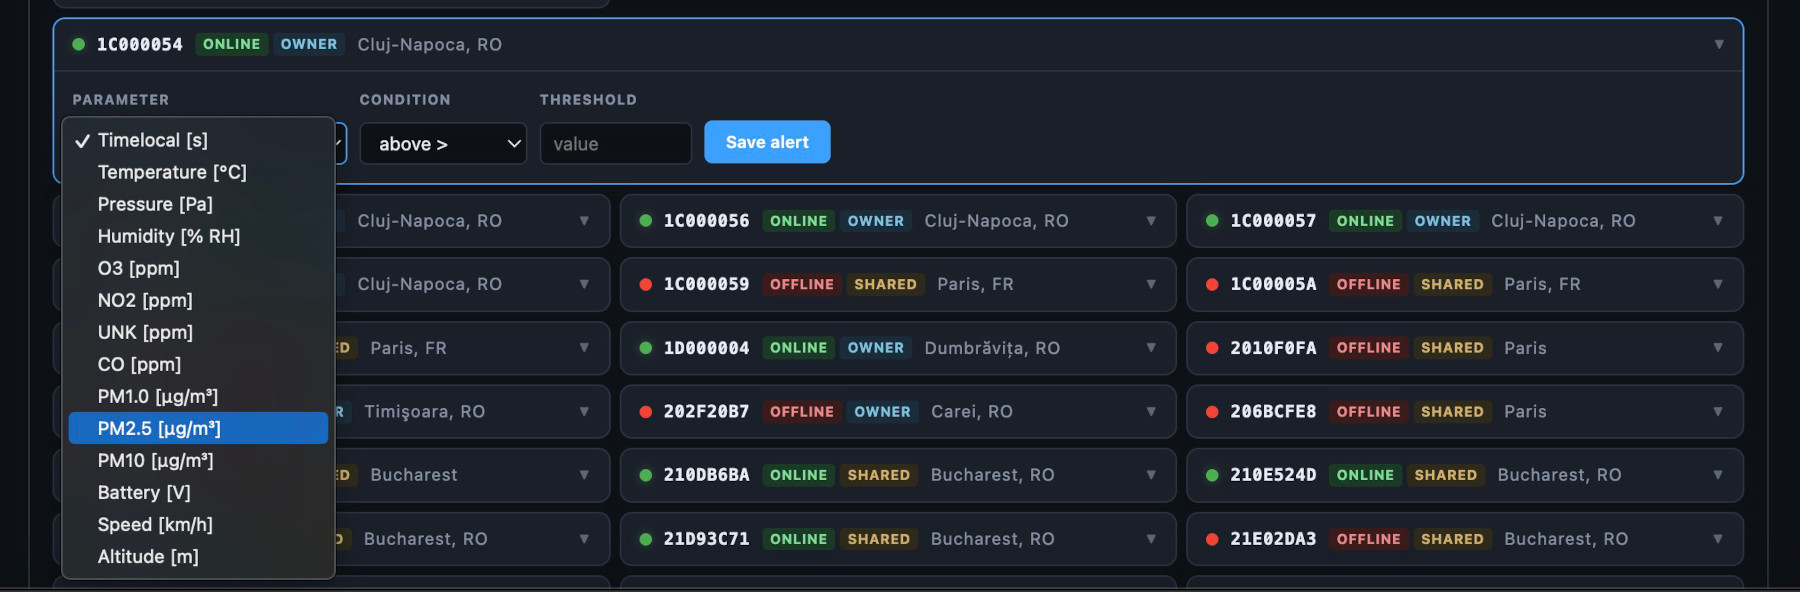
Alerts belong to the person who sets them, not to the device. In a school this allows, for example:
- the class teacher receives an alert when classroom CO₂ passes 1,500 ppm, the moment to open the windows;
- the administrator receives an alert when the VOC resistance drops sharply in an empty room, to check when and how the cleaning is done;
- the caretaker receives an alert when PM2.5 rises outside the normal range, for example during a smoke episode, to keep windows closed.
An alert does not ventilate a room. It tells someone that now is the moment to act.
A tool for responsibility, not only for compliance
The school’s public dashboard, uradmonitor.com/tools/users/scoaladumbravita, turns the readings into a daily air quality score, a weekly view and a monthly calendar, with tabs for charts, events and impact. It is available in Romanian and English, exports to PDF for the school’s reports and opens without an account, for teachers, parents, pupils and researchers.
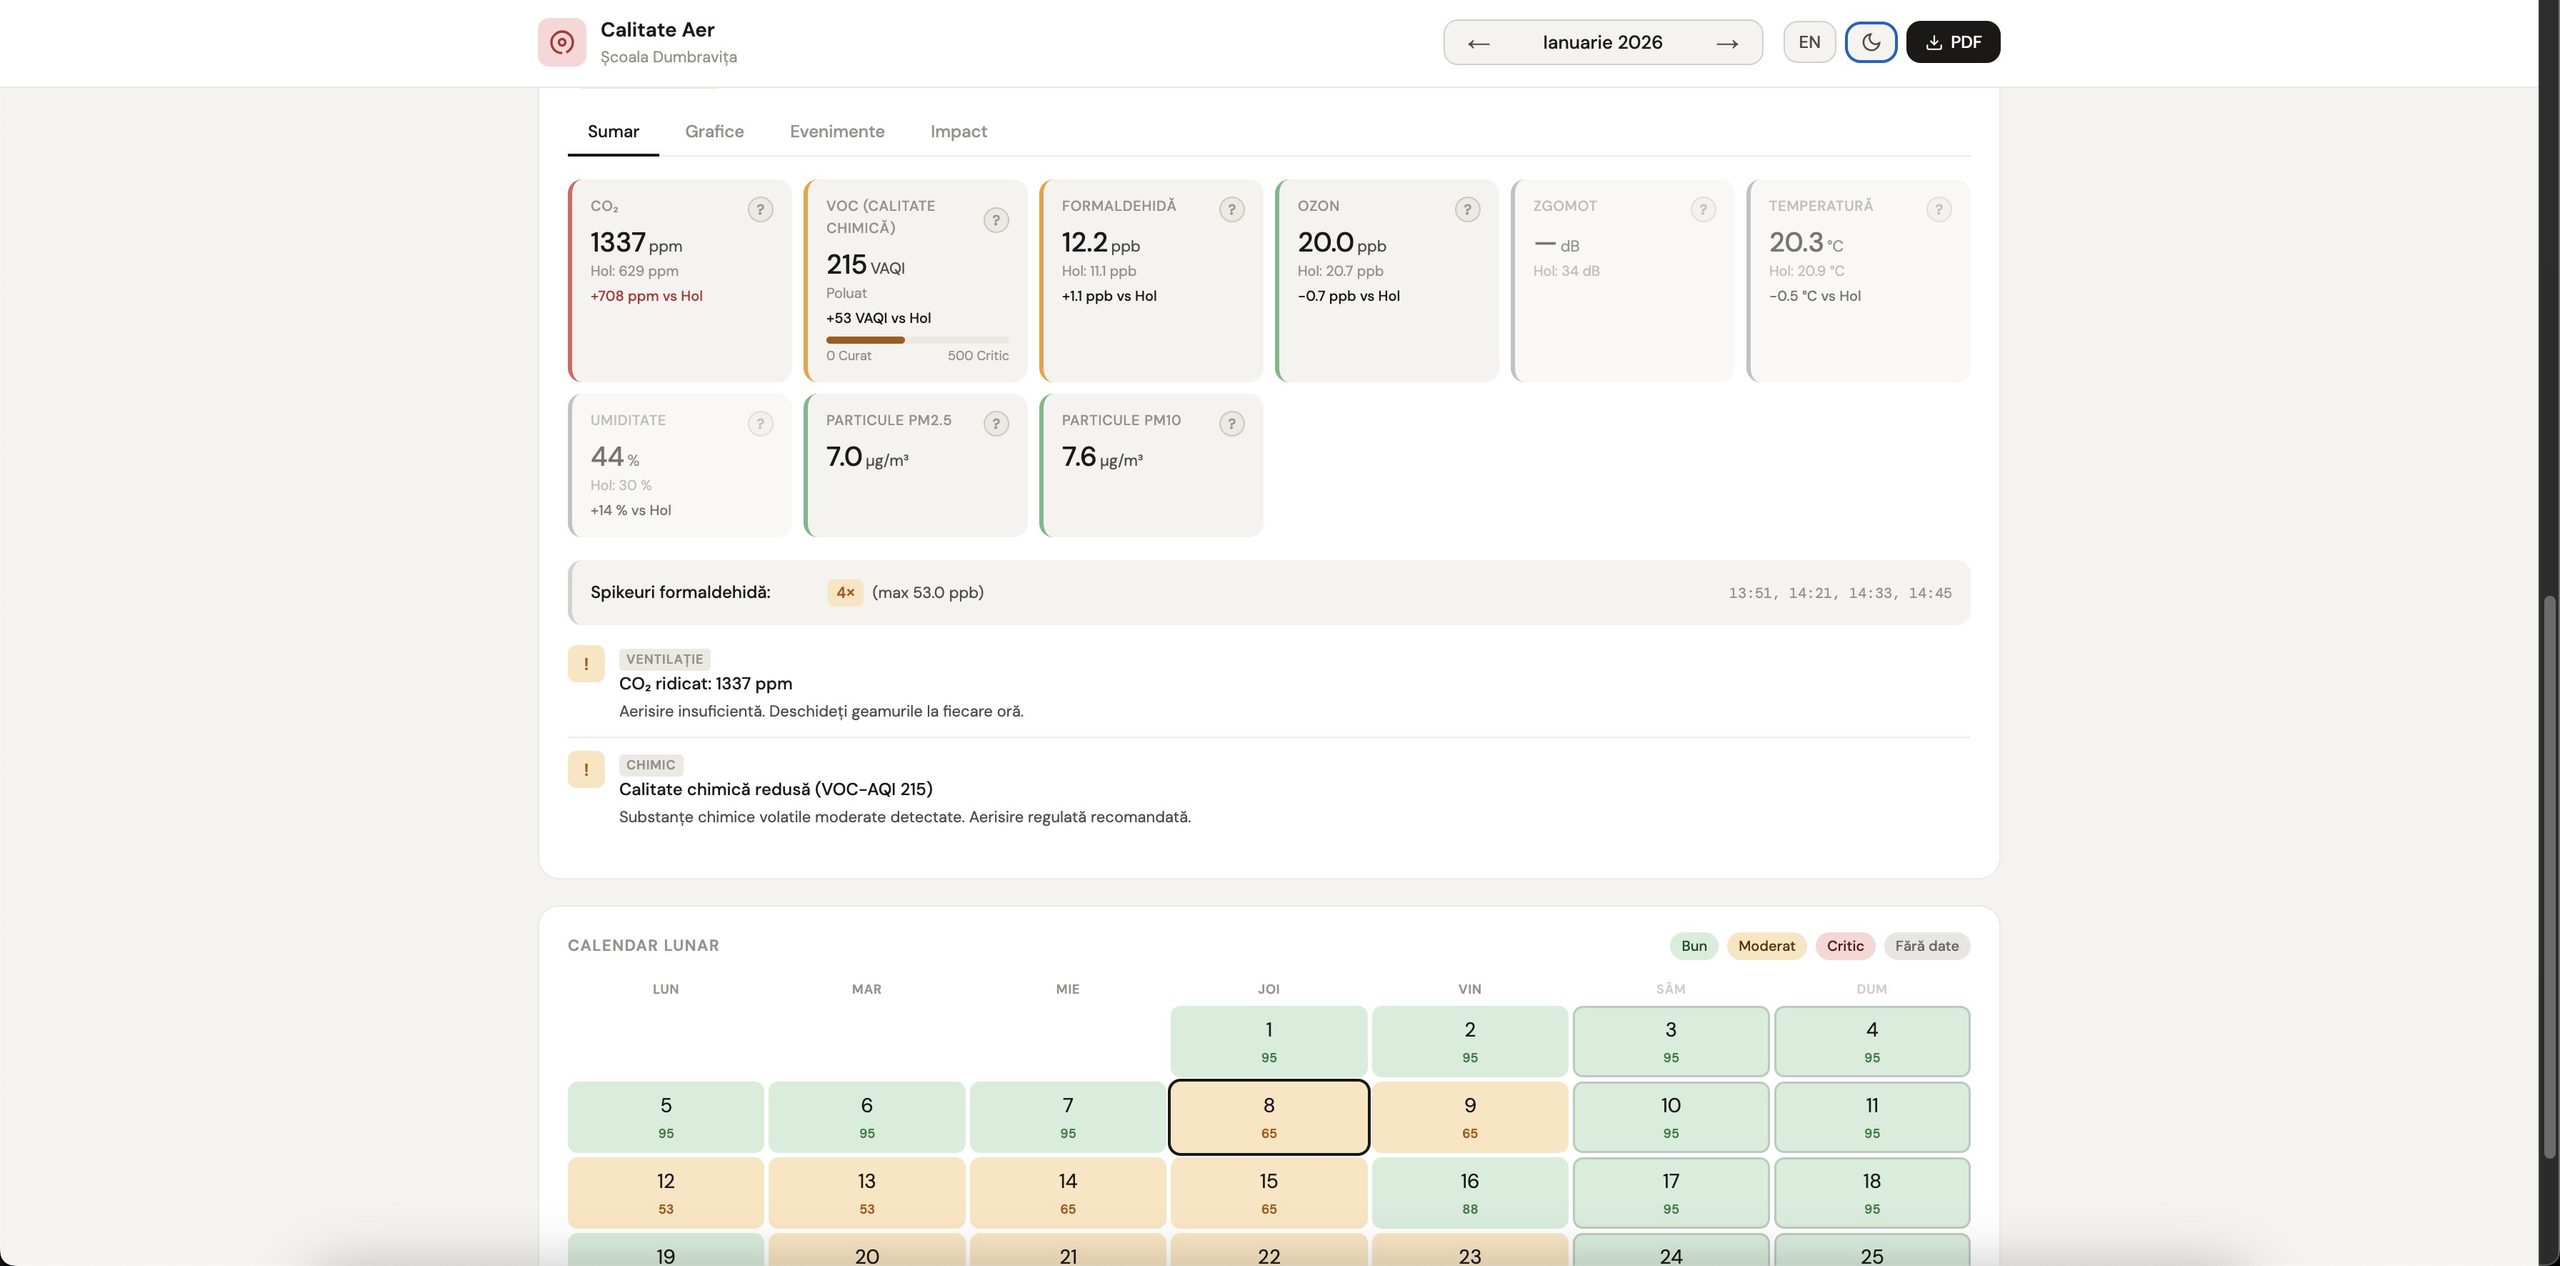
That openness is where sensors do more:
- Pupils can see the CO₂ curve of their own classroom and connect it to something they control: opening the windows at every break, not only at lunch.
- A class can compare a day with windows opened at every break with an ordinary day, and see the difference the next morning on the dashboard.
- Science lessons can use real measurements from their own room: where CO₂ comes from, why it rises during a lesson, what a VOC sensor detects.
- The noise curve gives a concrete starting point for a conversation about the loudest breaks.
- Parents see the same data as the school, which makes discussions about ventilation, cleaning and renovation concrete.
A sensor will not change habits on its own. It makes an invisible problem visible and measurable, and it shows whether a change in routine actually worked. For a school working towards green school status, that is the practical meaning of “monitoring”.
For contractors and designers
Many school renovation projects in Romania now include the F5 line “integrated environmental monitoring equipment”. The Dumbrăvița installation shows the typical configuration: one reference station for the building and one station in each monitored room, with the data public in real time. For tender documents we publish technical datasheets with a line-by-line compliance table.
Resources:
Configurations and quotes: greenschools.uradmonitor.com (English), scoliverzi.uradmonitor.com (Romanian).
MODEL A3 technical datasheet (EN): PDF · F5 technical sheet (RO): PDF
SMOGGIE-CO2 technical datasheet (EN): PDF · F5 technical sheet (RO): PDF
MODEL CITY technical datasheet (EN): PDF · F5 technical sheet (RO): PDF
Live data from Dumbrăvița: school dashboard
Figures are based on readings taken every three minutes by the two MODEL A3 stations between 1 December 2025 and 29 June 2026. Lesson-hour statistics use 08:00 to 16:30 on school days. Noise values of both stations are offset to a common 35 dB floor, as described above. uRADMonitor stations are indicative sensors, evaluated against reference instruments by AIRPARIF AIRLAB and AQ-SPEC. They show trends and episodes reliably but do not replace regulatory reference monitoring.
codemore code
~~~~