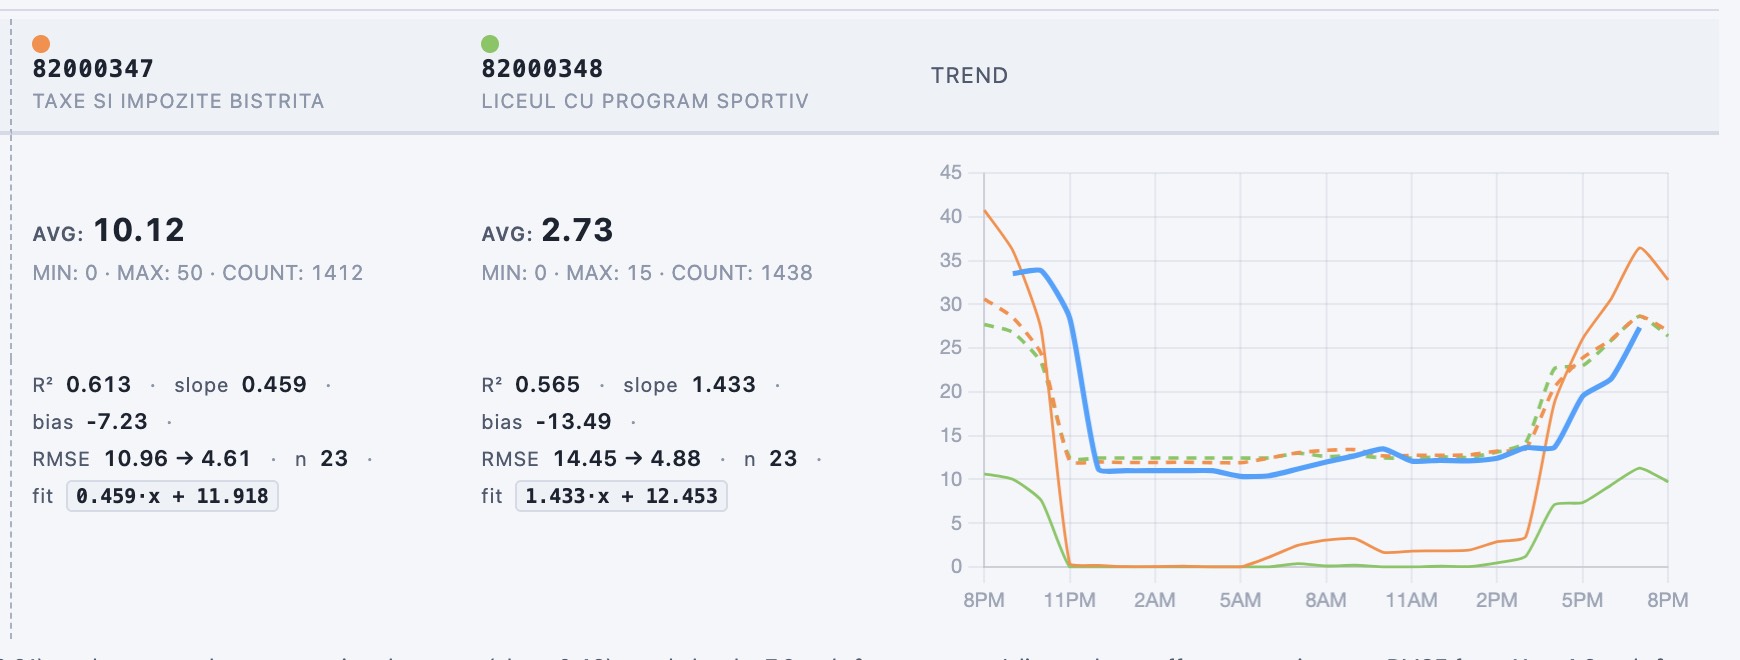
Following the recent integration of RNMCA , Romania’s national network of reference-grade air-quality stations, the uRADMonitor data flux now brings the two worlds together in one place: dense, low-cost sensors alongside the official reference. As a direct consequence, we have added a sensor intercomparison tool to the network, so you can measure one against the other directly.
In a few clicks you pick a reference station and a uRADMonitor sensor next to it, and in minutes you get the full picture of how well they agree, together with the exact correction that maps one onto the other. Not just for PM2.5, but for every parameter the sensors share.
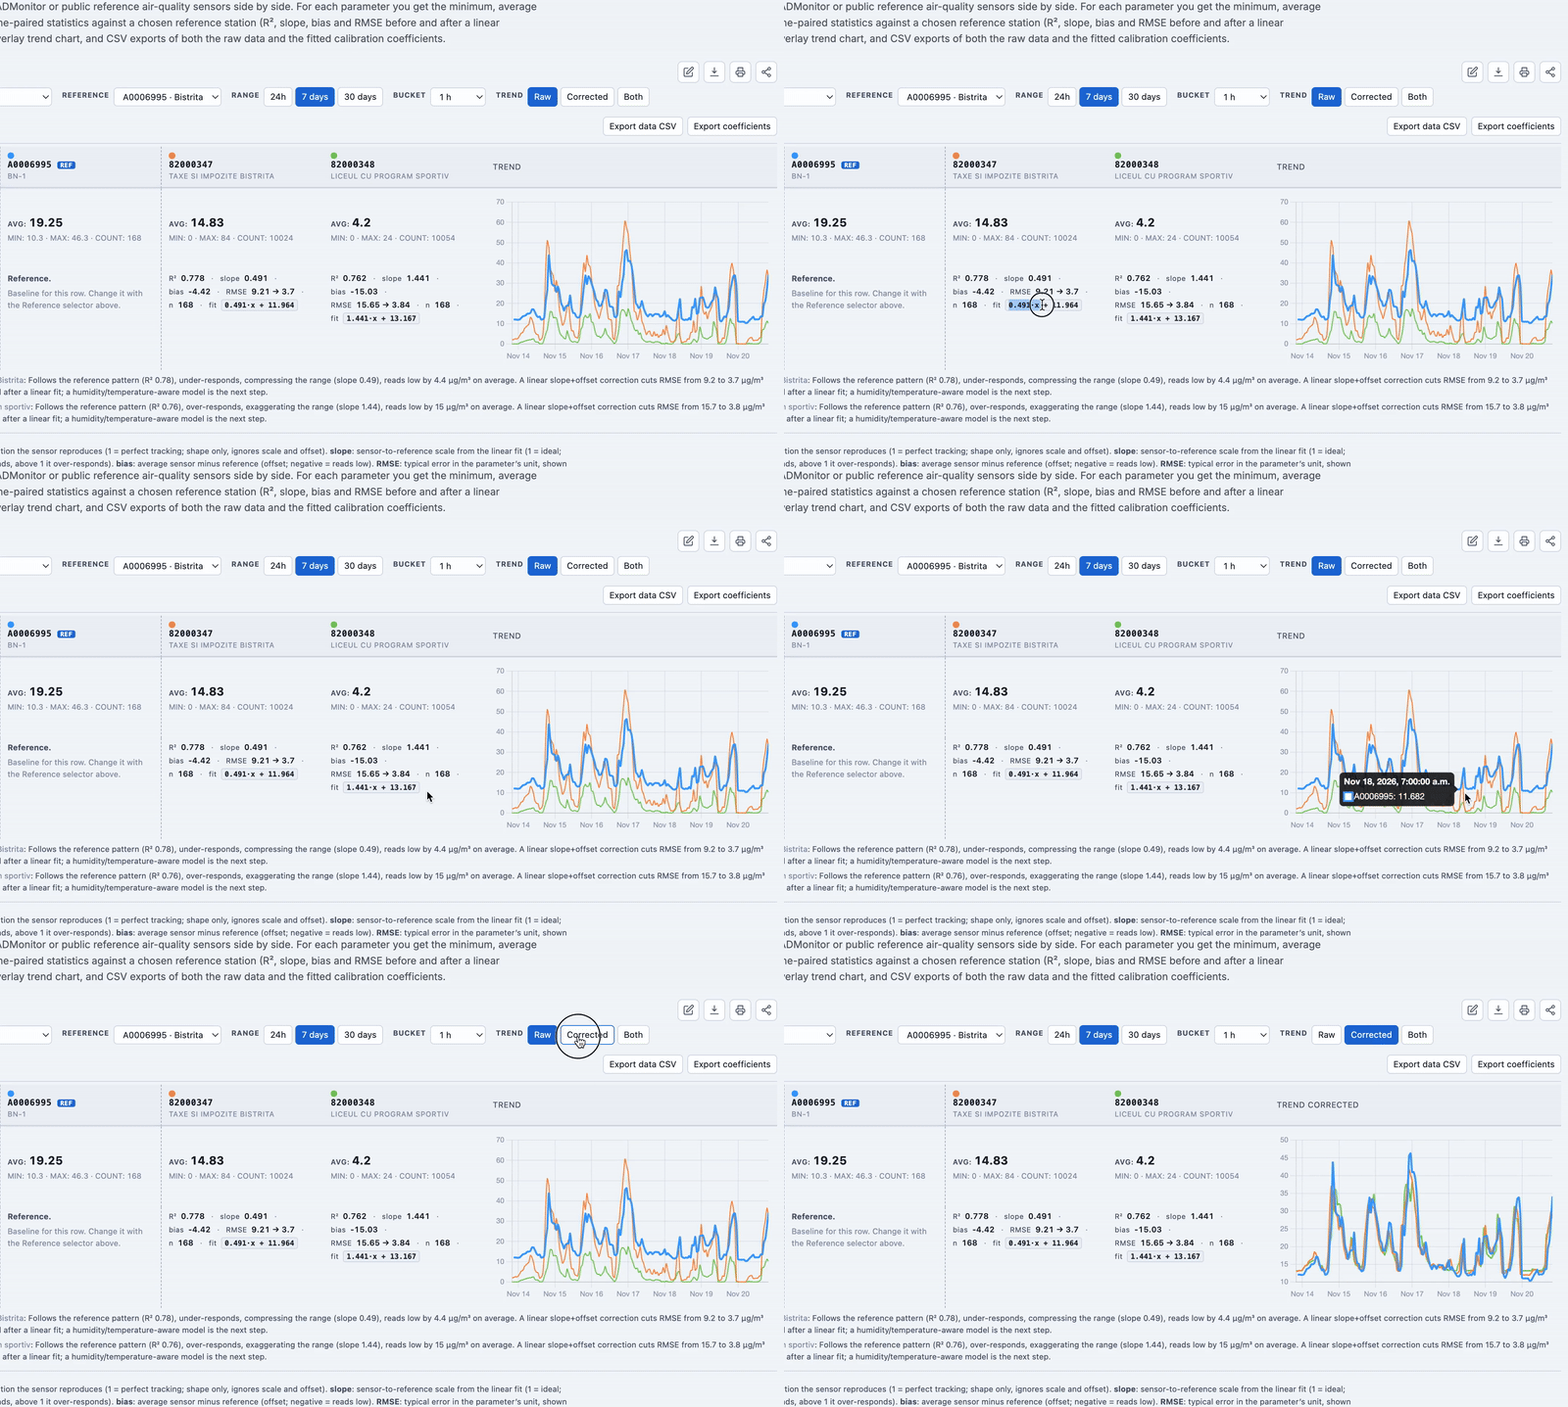
This is how a low-cost sensor earns reference-grade trust: measured against the reference, corrected automatically, dependable.
The old way: months of work for a single equation
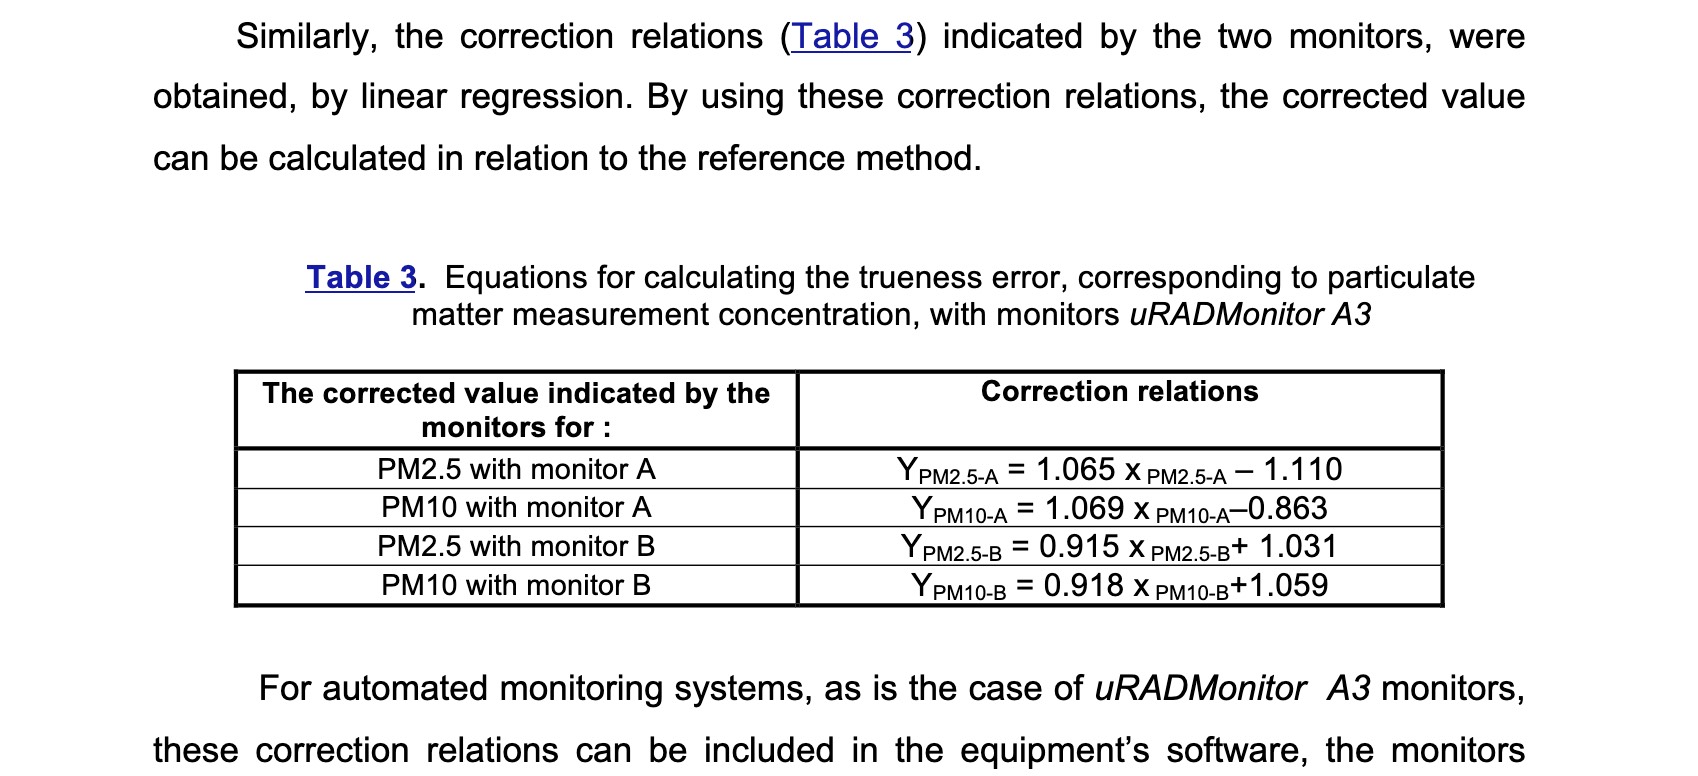
To understand why this matters, look at how it used to be done. In 2019 the National Research and Development Institute for Industrial Ecology (INCD-ECOIND) ran a formal evaluation of a uRADMonitor MODEL A3 against reference-grade instrumentation. The result was a validated linear correction for the sensor’s PM2.5 readings, and it stands as solid, independent science.
But getting there took months of controlled measurement and thousands of euros of instrument time and expert labour, and it produced one equation, for one parameter, on one unit. That is the real cost of anchoring a low-cost sensor to the truth the traditional way. It does not scale to a network of thousands of sensors across dozens of countries.
The full report is public: INCD-ECOIND final report, Magnasci / uRADMonitor A3 (HW107).
The new way: a reference, a neighbour, and a few clicks
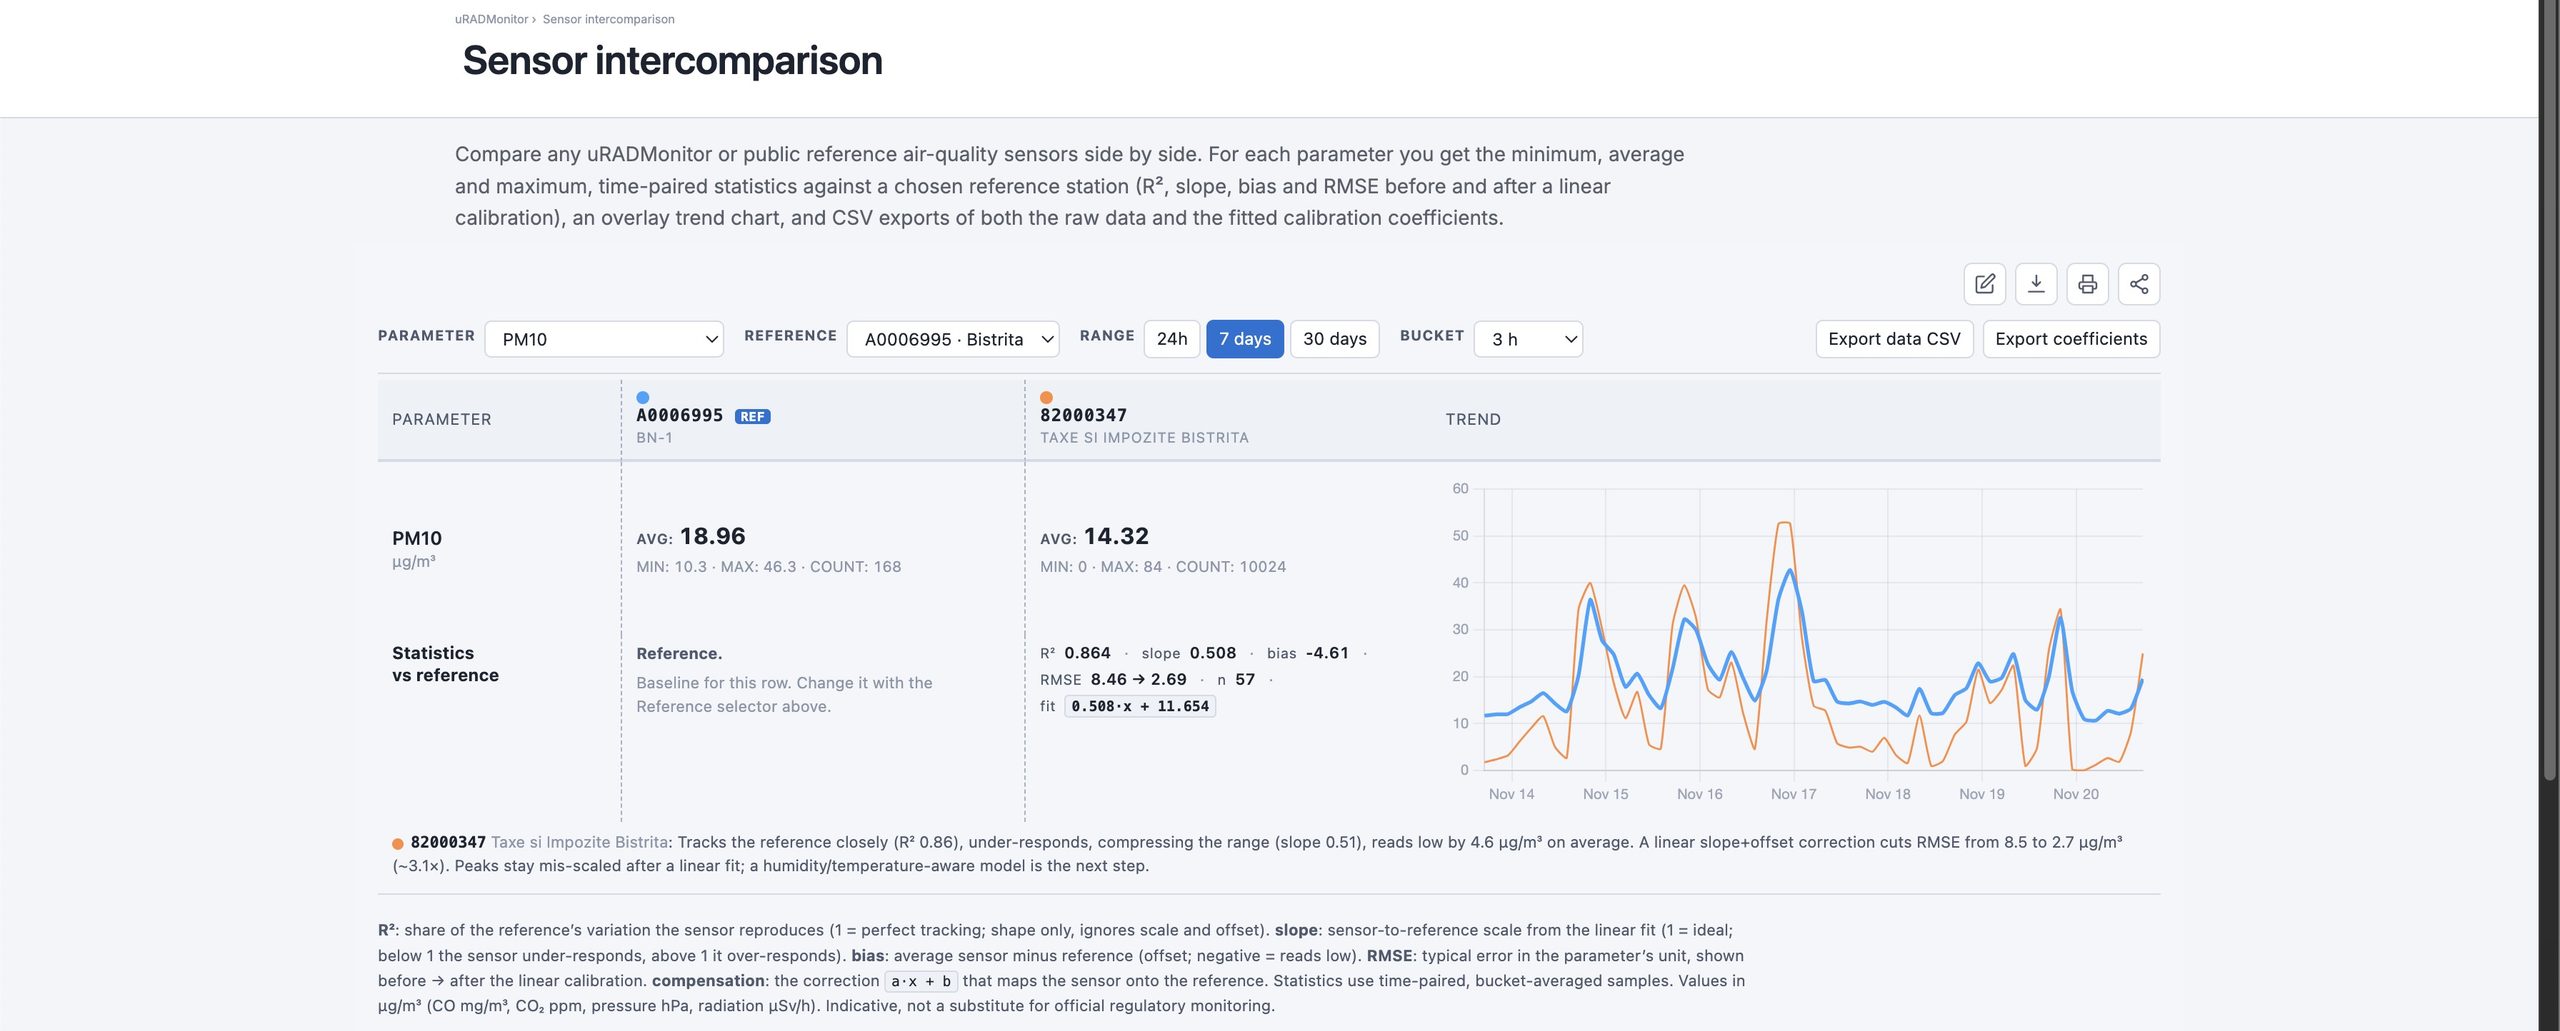
The intercomparison tool turns that months-long study into an interactive query. You give it two or more sensor IDs, choose which one is the reference, and it does the rest:
- it time-pairs the two series on a common interval (bucket-averaged, so the comparison is fair);
- it fits a linear model
reference = a · sensor + band reports R² (how well the shapes track), slope (scale), bias (offset) and RMSE before and after correction; - it prints the compensation you would apply,
a · x + b, ready to drop into firmware or a data pipeline; - it overlays both time series so you can see where they agree and where they drift;
- and it does all of this for every parameter the sensors share, not just PM2.5: PM10, ozone, NO₂, CO₂, temperature, and the rest.
What INCD-ECOIND (but also other lab tests that followed) produced for one parameter in months, you can now reproduce for any parameter, in the time it takes to read this sentence! It is not a replacement for an accredited lab study because colocation even at a short distance can’t qualify as taking place under controlled, fully characterisable conditions. So we are careful to label it as indicative. But as a working instrument for calibration, debugging and research, it is a huge step change for new directions in improving low-cost sensor accuracy.
Built to be used: export, share, reuse
The tool is parametrisable and reusable by design. Every view is a URL, so a comparison is a link you can bookmark or send to a colleague. From the toolbar you can save the whole report as a PNG, print it or save it as a PDF, and share the exact view. Two CSV exports are one click away: the raw time-paired data, and the fitted calibration coefficients (slope, intercept, R², RMSE and a written performance note per sensor).
That makes it useful in two very different jobs: debugging (is this sensor drifting, is that spike real, does a unit disagree with its neighbours?) and research and correction (derive a compensation, document agreement, feed a calibration pipeline).
Where this is going: a self-calibrating network
This tool is the visible, manual first step of a larger idea. The expensive part of calibration has always been producing the correction. Now that producing it is cheap and repeatable, it can be automated, scaled, reused endlessly .
The direction is a network that anchors low-cost data to government reference sensors by automatically correcting its own errors: wherever a uRADMonitor sensor sits near a reference station, the network can continuously derive and refresh the correction for that location and sensor, propagate it to similar nearby units, and keep doing so as environmental conditions change. We have the data. Every reference pairing becomes a calibration anchor, and the whole network drifts toward higher accuracy over time instead of away from it. Integrating public reference networks such as RNMCA is exactly what makes those anchors available at scale.
Manual intercomparison today, automatic self-calibration tomorrow. The instrument you can try right now is the foundation for it, its very early steps.
Try it now!
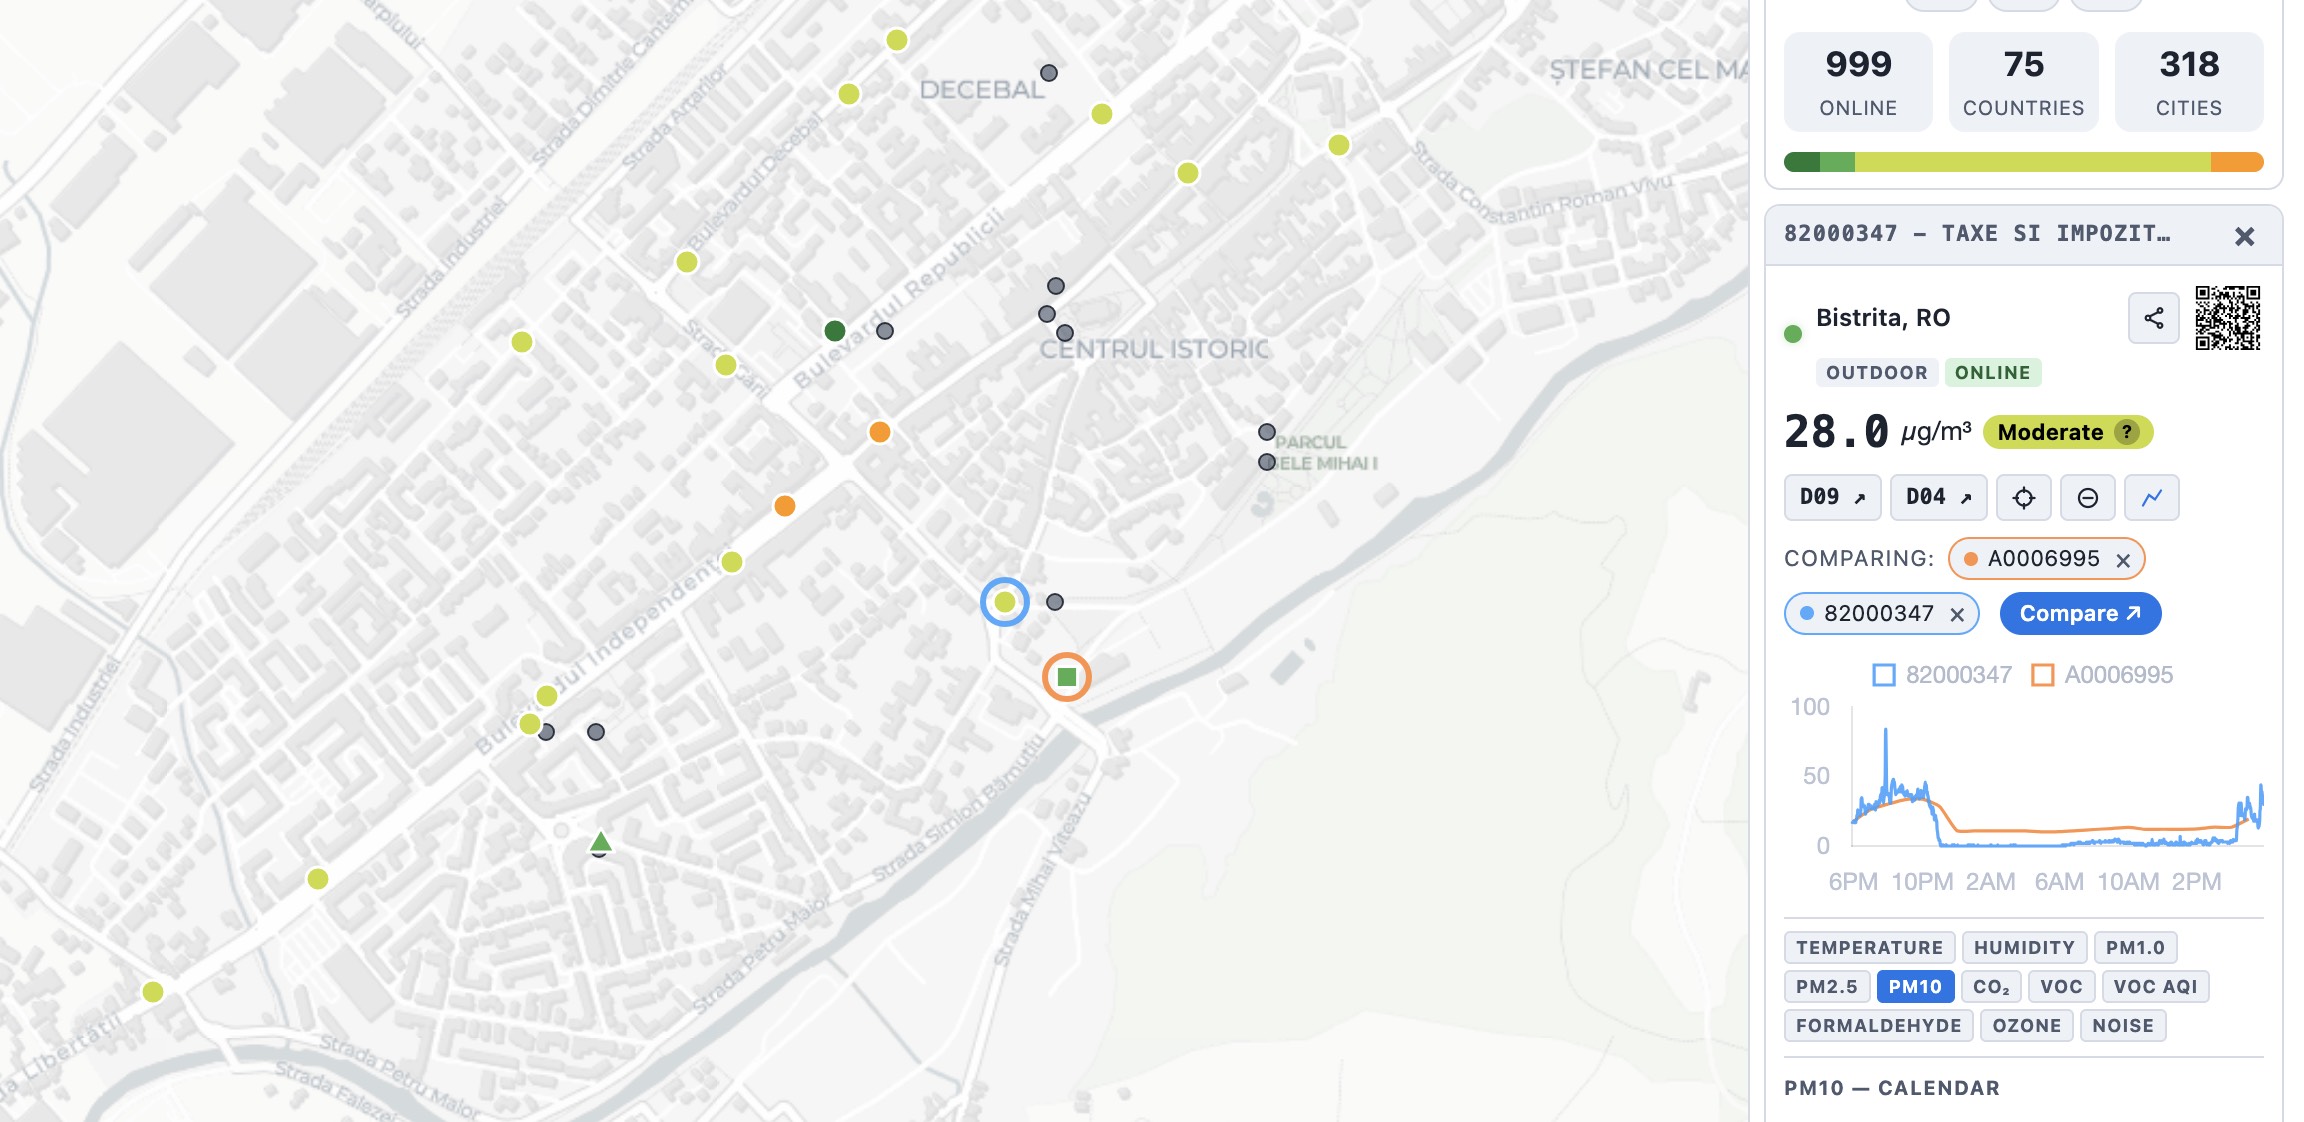
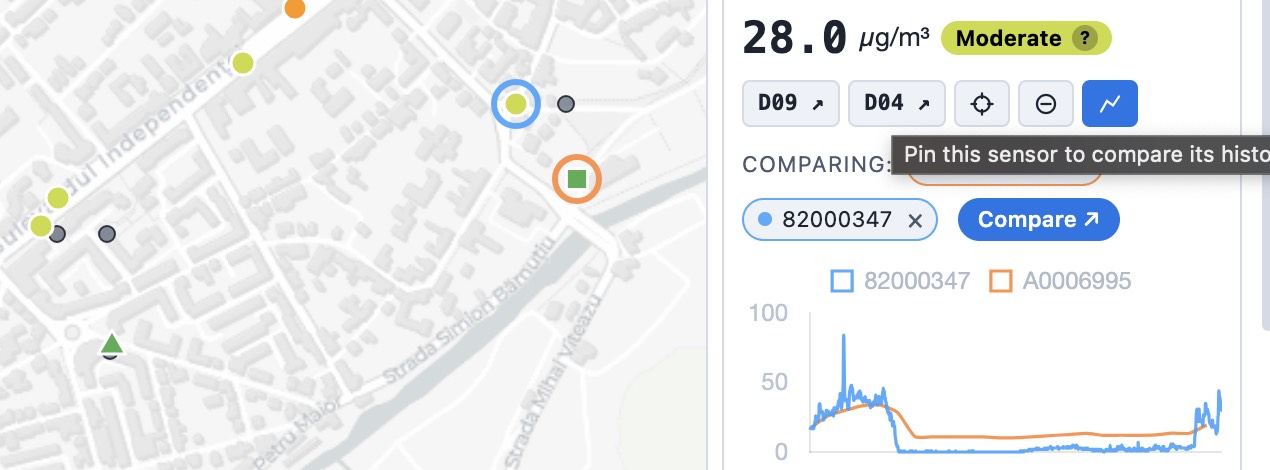
Open the tool, enter two or more sensor IDs and pick your reference. A reference station and a uRADMonitor sensor in the same city make a natural pair. Or on the live air quality map, select a sensor, click the “Pin to compare” button, then select the second sensor and click Pin to chart again, then press compare:
Readings and statistics are indicative and not a substitute for official regulatory monitoring.
Liked this? Get monthly air quality findings.
One email a month from the uRADMonitor network. Unsubscribe anytime.
codemore code
~~~~