

Radiation is everywhere. It comes from the ground under our feet, from space and from the air we breathe. A Geiger counter placed anywhere on Earth will never read zero. So the useful question is not whether there is radiation, but whether the level you see is normal.
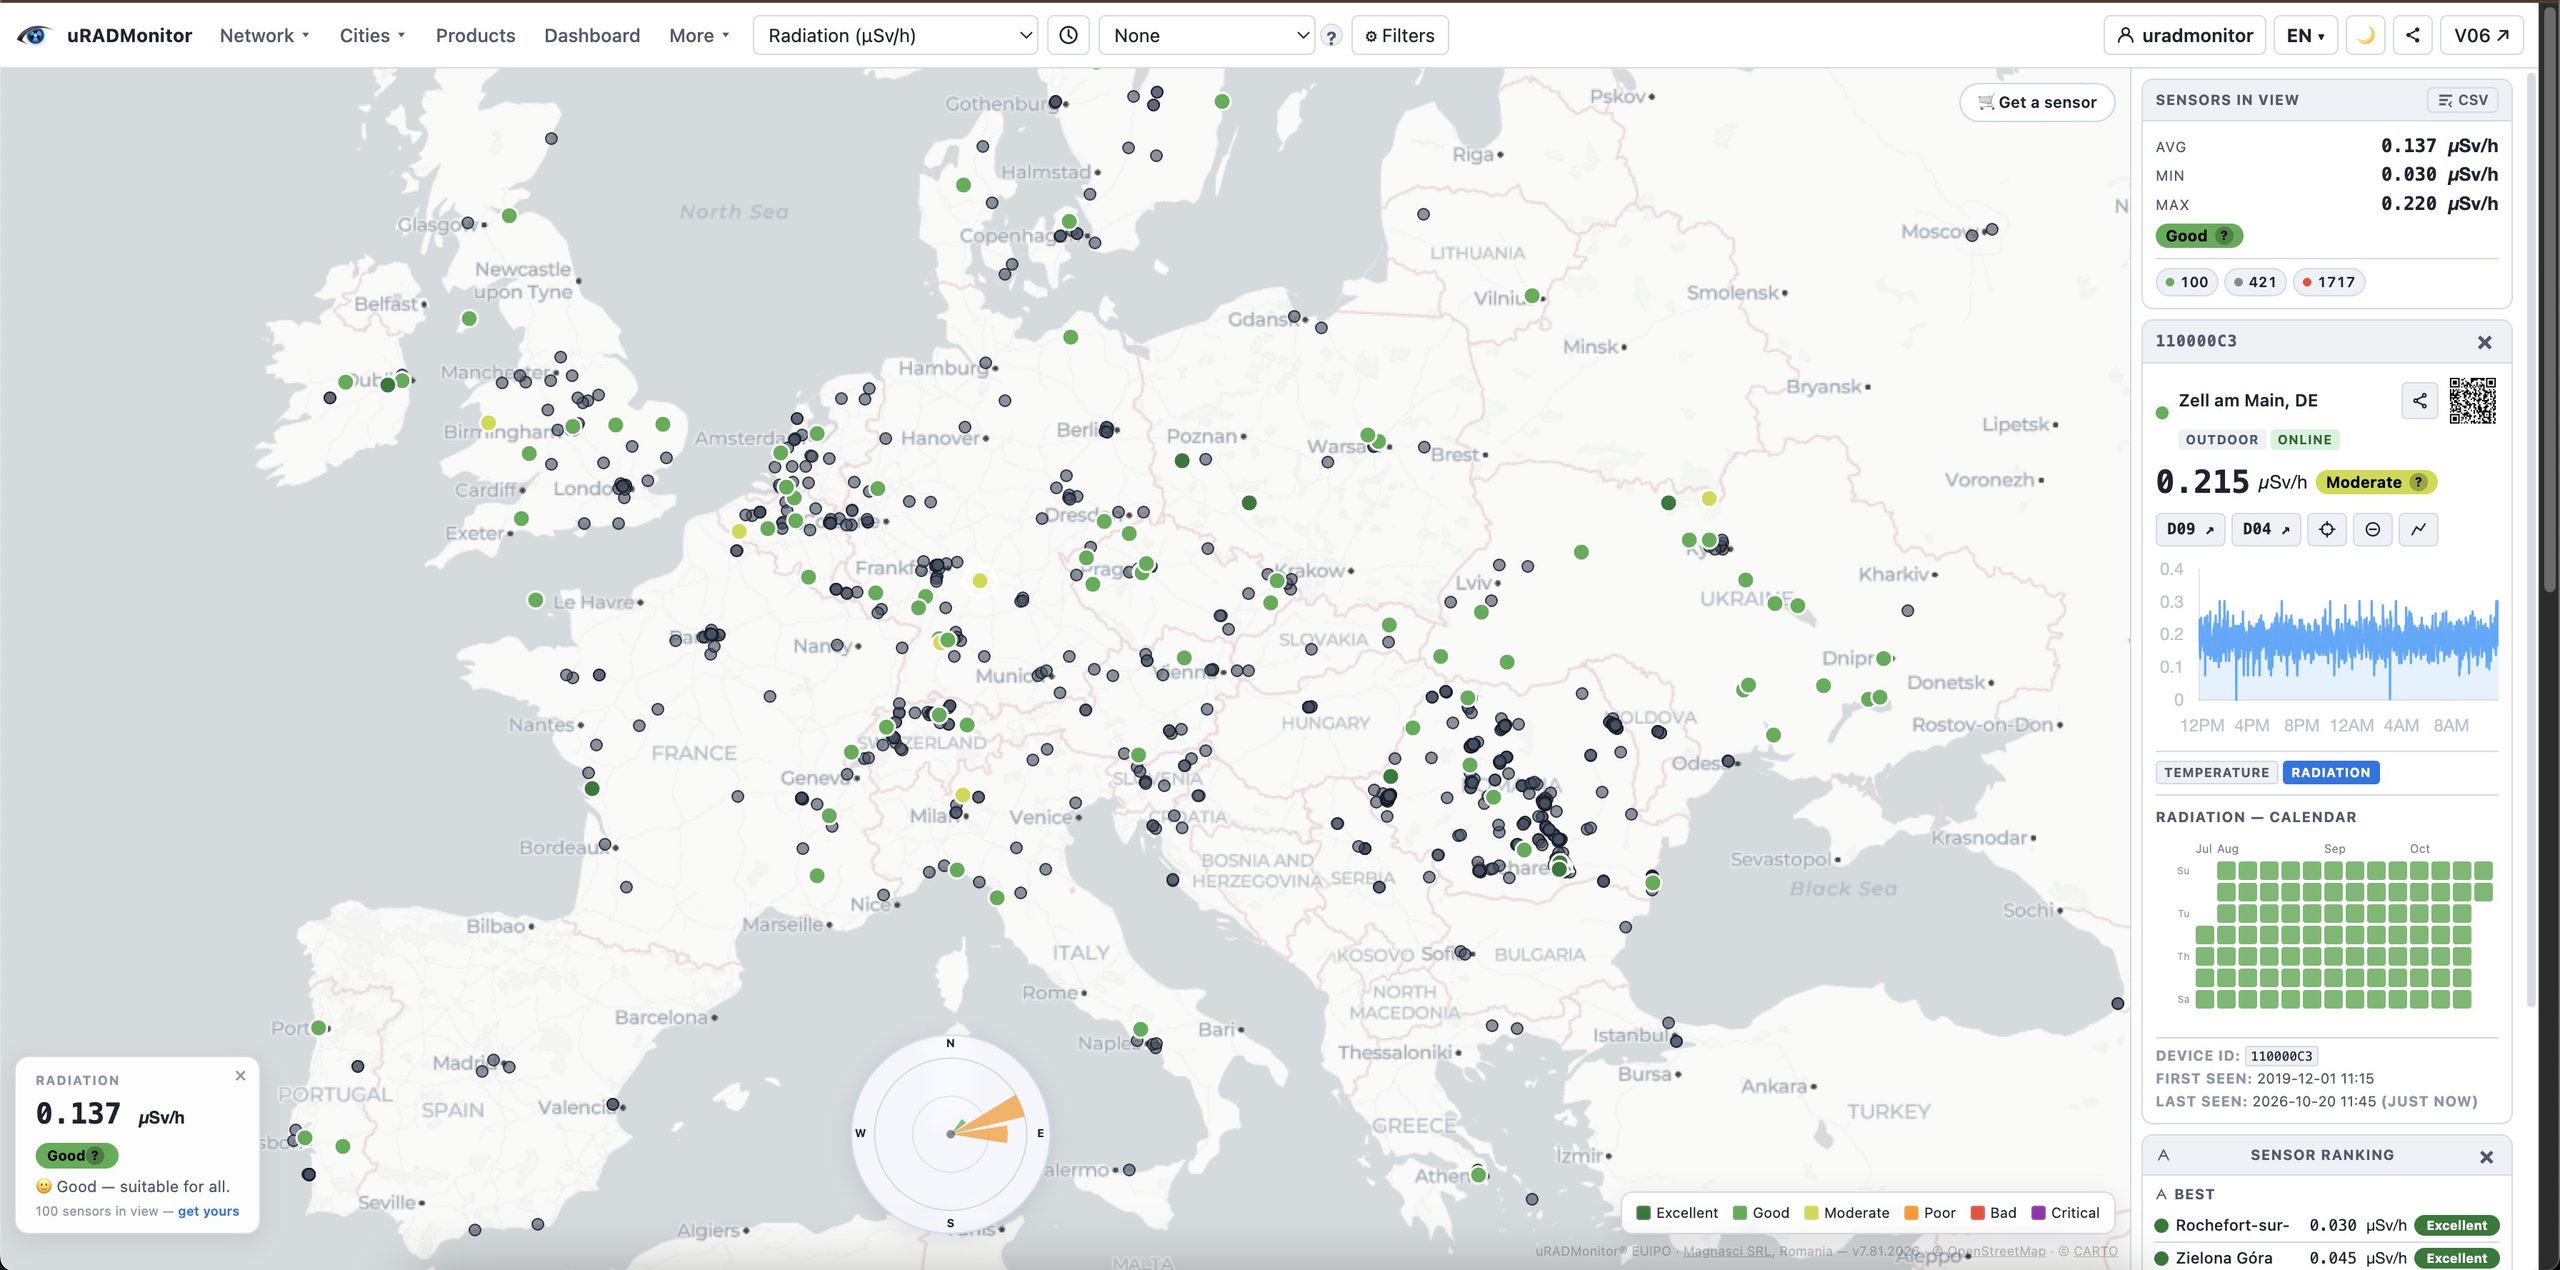
This guide explains the units, the typical values, what makes them change, and when a reading deserves attention. You can compare everything with the live radiation levels by country measured by the uRADMonitor network.
The units: µSv/h, mSv per year and CPM
- µSv/h (microsieverts per hour) is the dose rate: how much radiation a person would receive in one hour at that spot. Monitoring stations and maps use this unit.
- mSv per year (millisieverts) is the accumulated dose. 1 mSv equals 1,000 µSv.
- CPM (counts per minute) is the raw number of particles a Geiger tube detects. It depends on the tube. The same place gives different CPM values on different detectors, so CPM is converted to µSv/h with a factor specific to each tube.
When you compare readings from different devices, you compare µSv/h, not CPM, as the latter would be tube dependant and not directly comparable.
Typical background levels
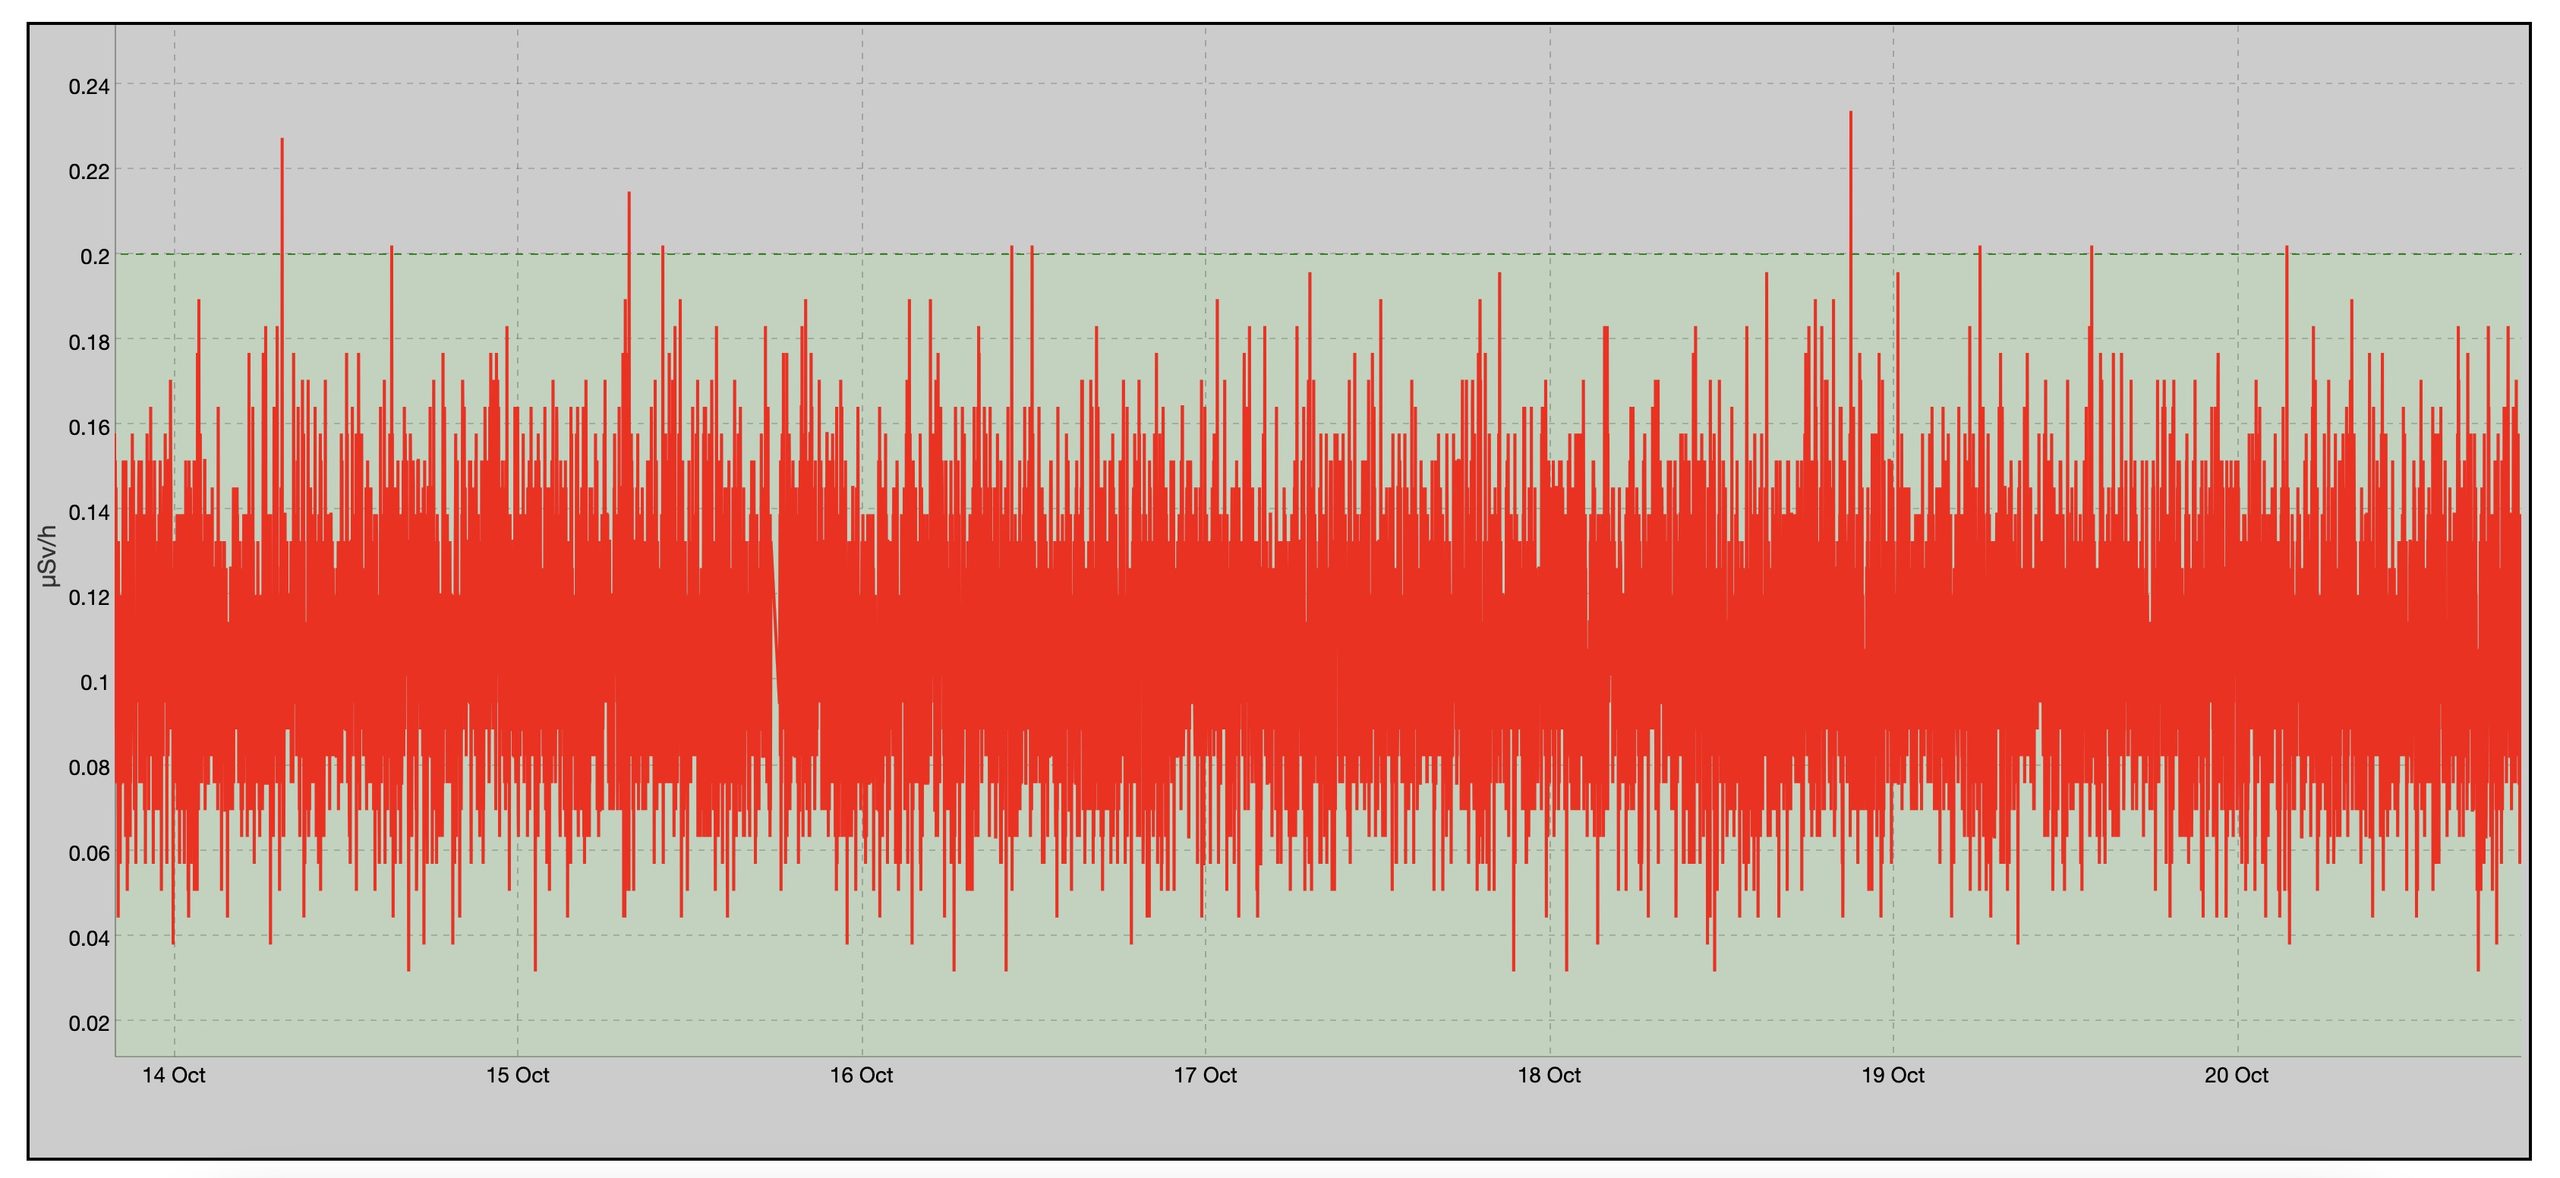
Outdoor background radiation is typically between about 0.05 and 0.20 µSv/h. Most of the uRADMonitor stations in Europe report values in this range every day.
Over a year, the total natural exposure of a person is about 2.4 mSv on world average, according to UNSCEAR. That total includes radon inhaled indoors, which is often the largest share. The external gamma radiation that a Geiger counter measures is only one part of it.
What makes the level change
Altitude
Cosmic radiation increases with altitude. A station in the mountains reads more than one at sea level. On a long-haul flight the dose rate is many times higher than on the ground.
Geology
Granite and some volcanic rocks contain more uranium and thorium than sedimentary soils. Regions built on such rock have a higher natural background.
Rain
Rain washes radon decay products out of the air onto the ground. The dose rate can rise noticeably during and after rain, then return to normal within a few hours. This is the most common cause of a sudden increase on a radiation map.
Buildings
Indoors, building materials such as brick, concrete and granite add their own contribution. Indoor readings are often slightly higher than outdoor ones.
How it compares with everyday doses
| Source | Approximate dose |
|---|---|
| One hour of normal background (0.1 µSv/h) | 0.0001 mSv |
| Chest X-ray | about 0.02 to 0.1 mSv |
| Long-haul flight | about 0.03 to 0.1 mSv |
| One year of natural background (world average) | about 2.4 mSv |
| EU dose limit for the public from artificial sources | 1 mSv per year |
The EU limit of 1 mSv per year applies to exposure from artificial sources, such as industry. It excludes natural background and medical procedures.
When a reading deserves attention
- A short rise during rain is normal.
- One station far above its neighbours usually points to a local source or a detector problem. Look at the station’s history before drawing conclusions.
- A sustained rise at several stations in the same region, not linked to weather, is what matters. This is how networks detect real events.
The value of a network comes from comparison. One detector shows a number. Hundreds of detectors show whether that number is unusual.
When a number becomes a story: the South China Sea hoax
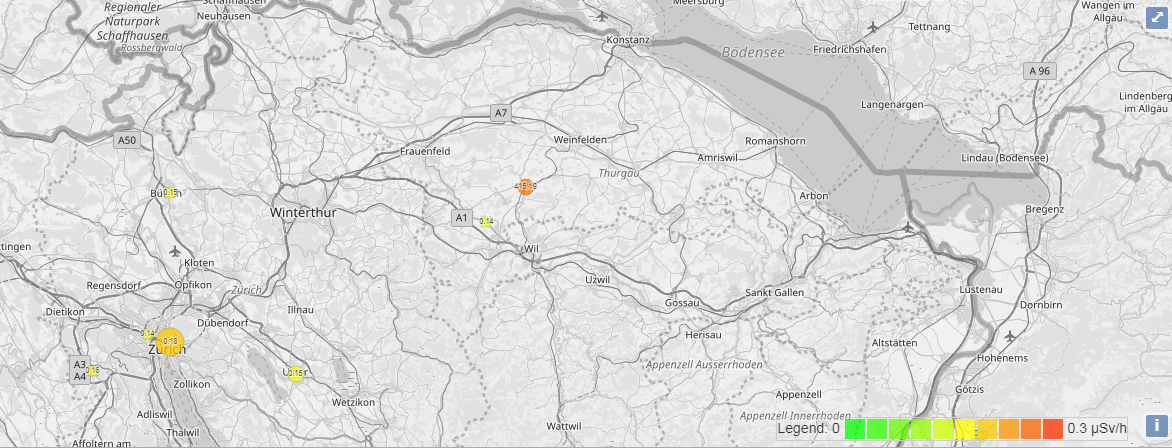
In November 2019, a US radio host published a claim that China had secretly detonated a 10-20 kiloton nuclear device in the South China Sea, and cited the uRADMonitor network as evidence of rising radiation. The story spread on social media and reached Russian official channels before a Pentagon spokesperson called it “silly fiction.” There was no seismic event, no corroborating data from any scientific instrument, and a review of the actual uRADMonitor readings showed no anomaly. The claim about the network’s data was simply false.
The episode illustrates the specific risk of open radiation data: a real network with real sensors can be cited for events that never happened, by people who either misread the data or have a different agenda. The “fix” is the same context this guide describes: to know the baseline, geography, multiple stations, time window. One number without that context is not evidence of anything. Keep this in mind.
Full account: Bulletin of the Atomic Scientists, November 2019
Check the level where you live
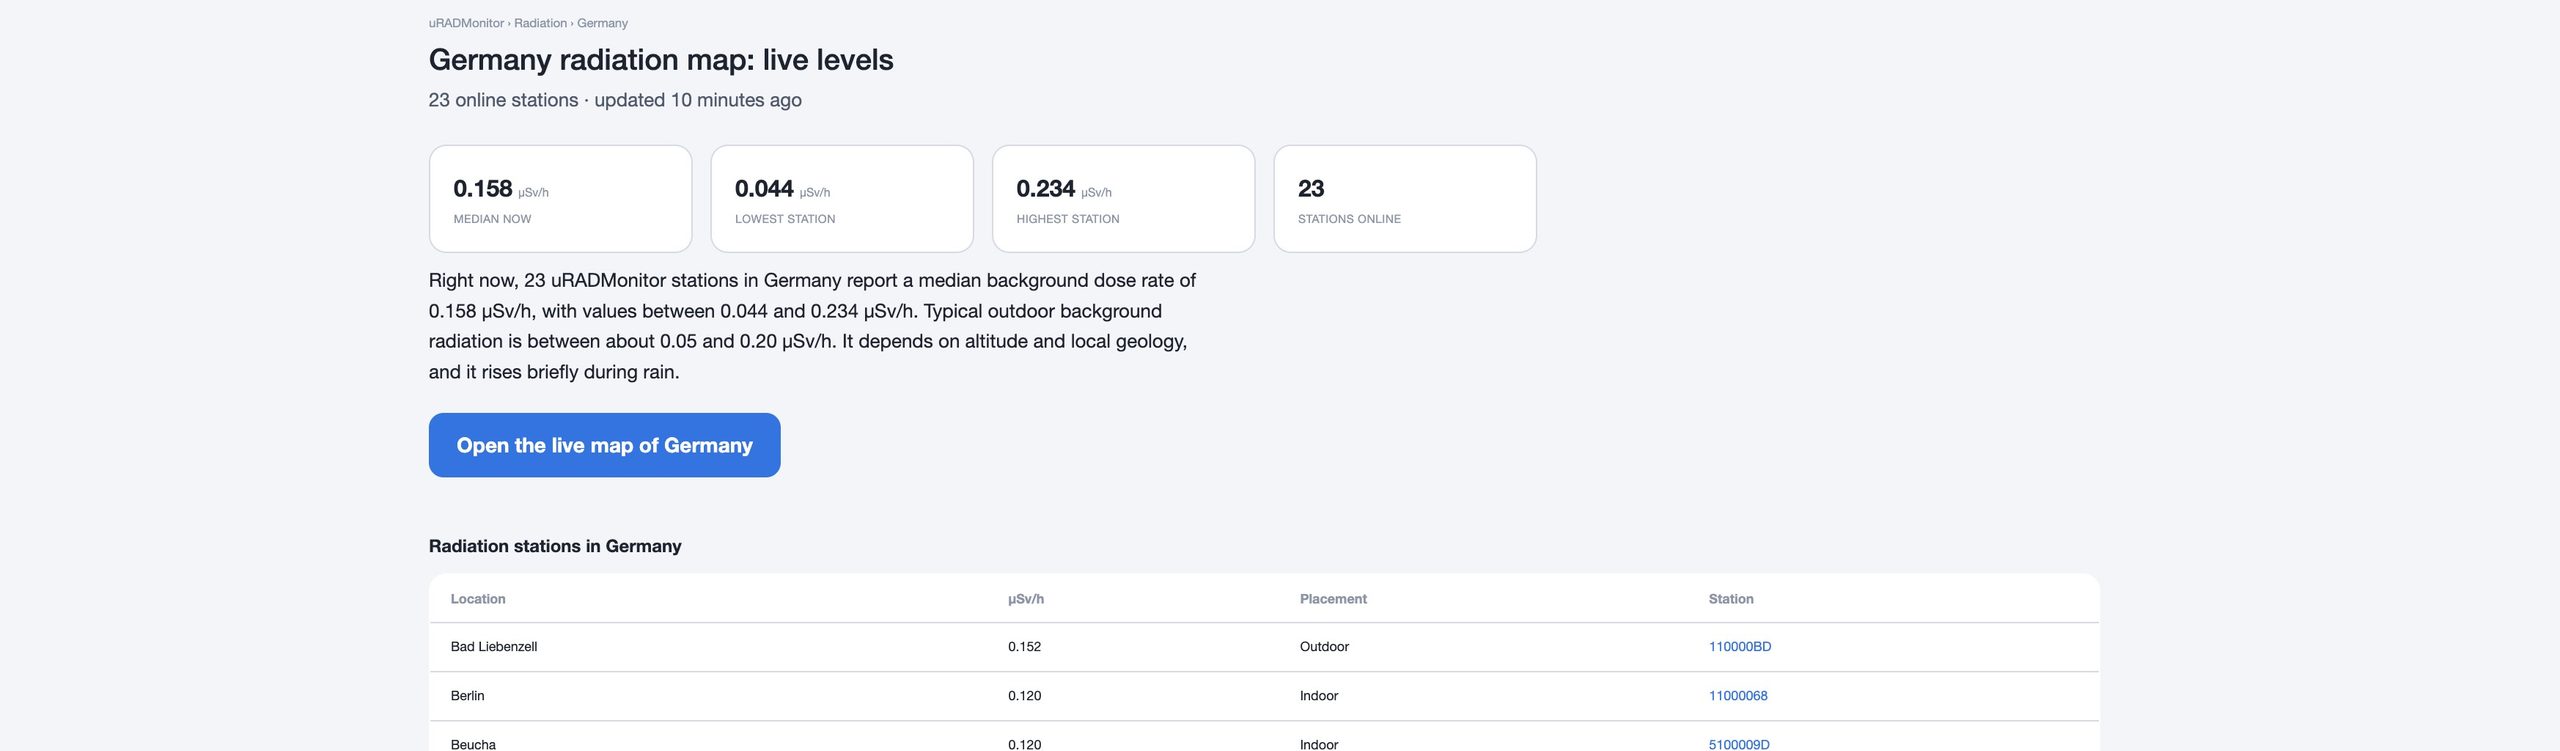
The uRADMonitor network publishes live radiation values from stations in more than 20 countries. Each country page shows the median, the lowest and the highest station, and the full station list:
Measure it yourself
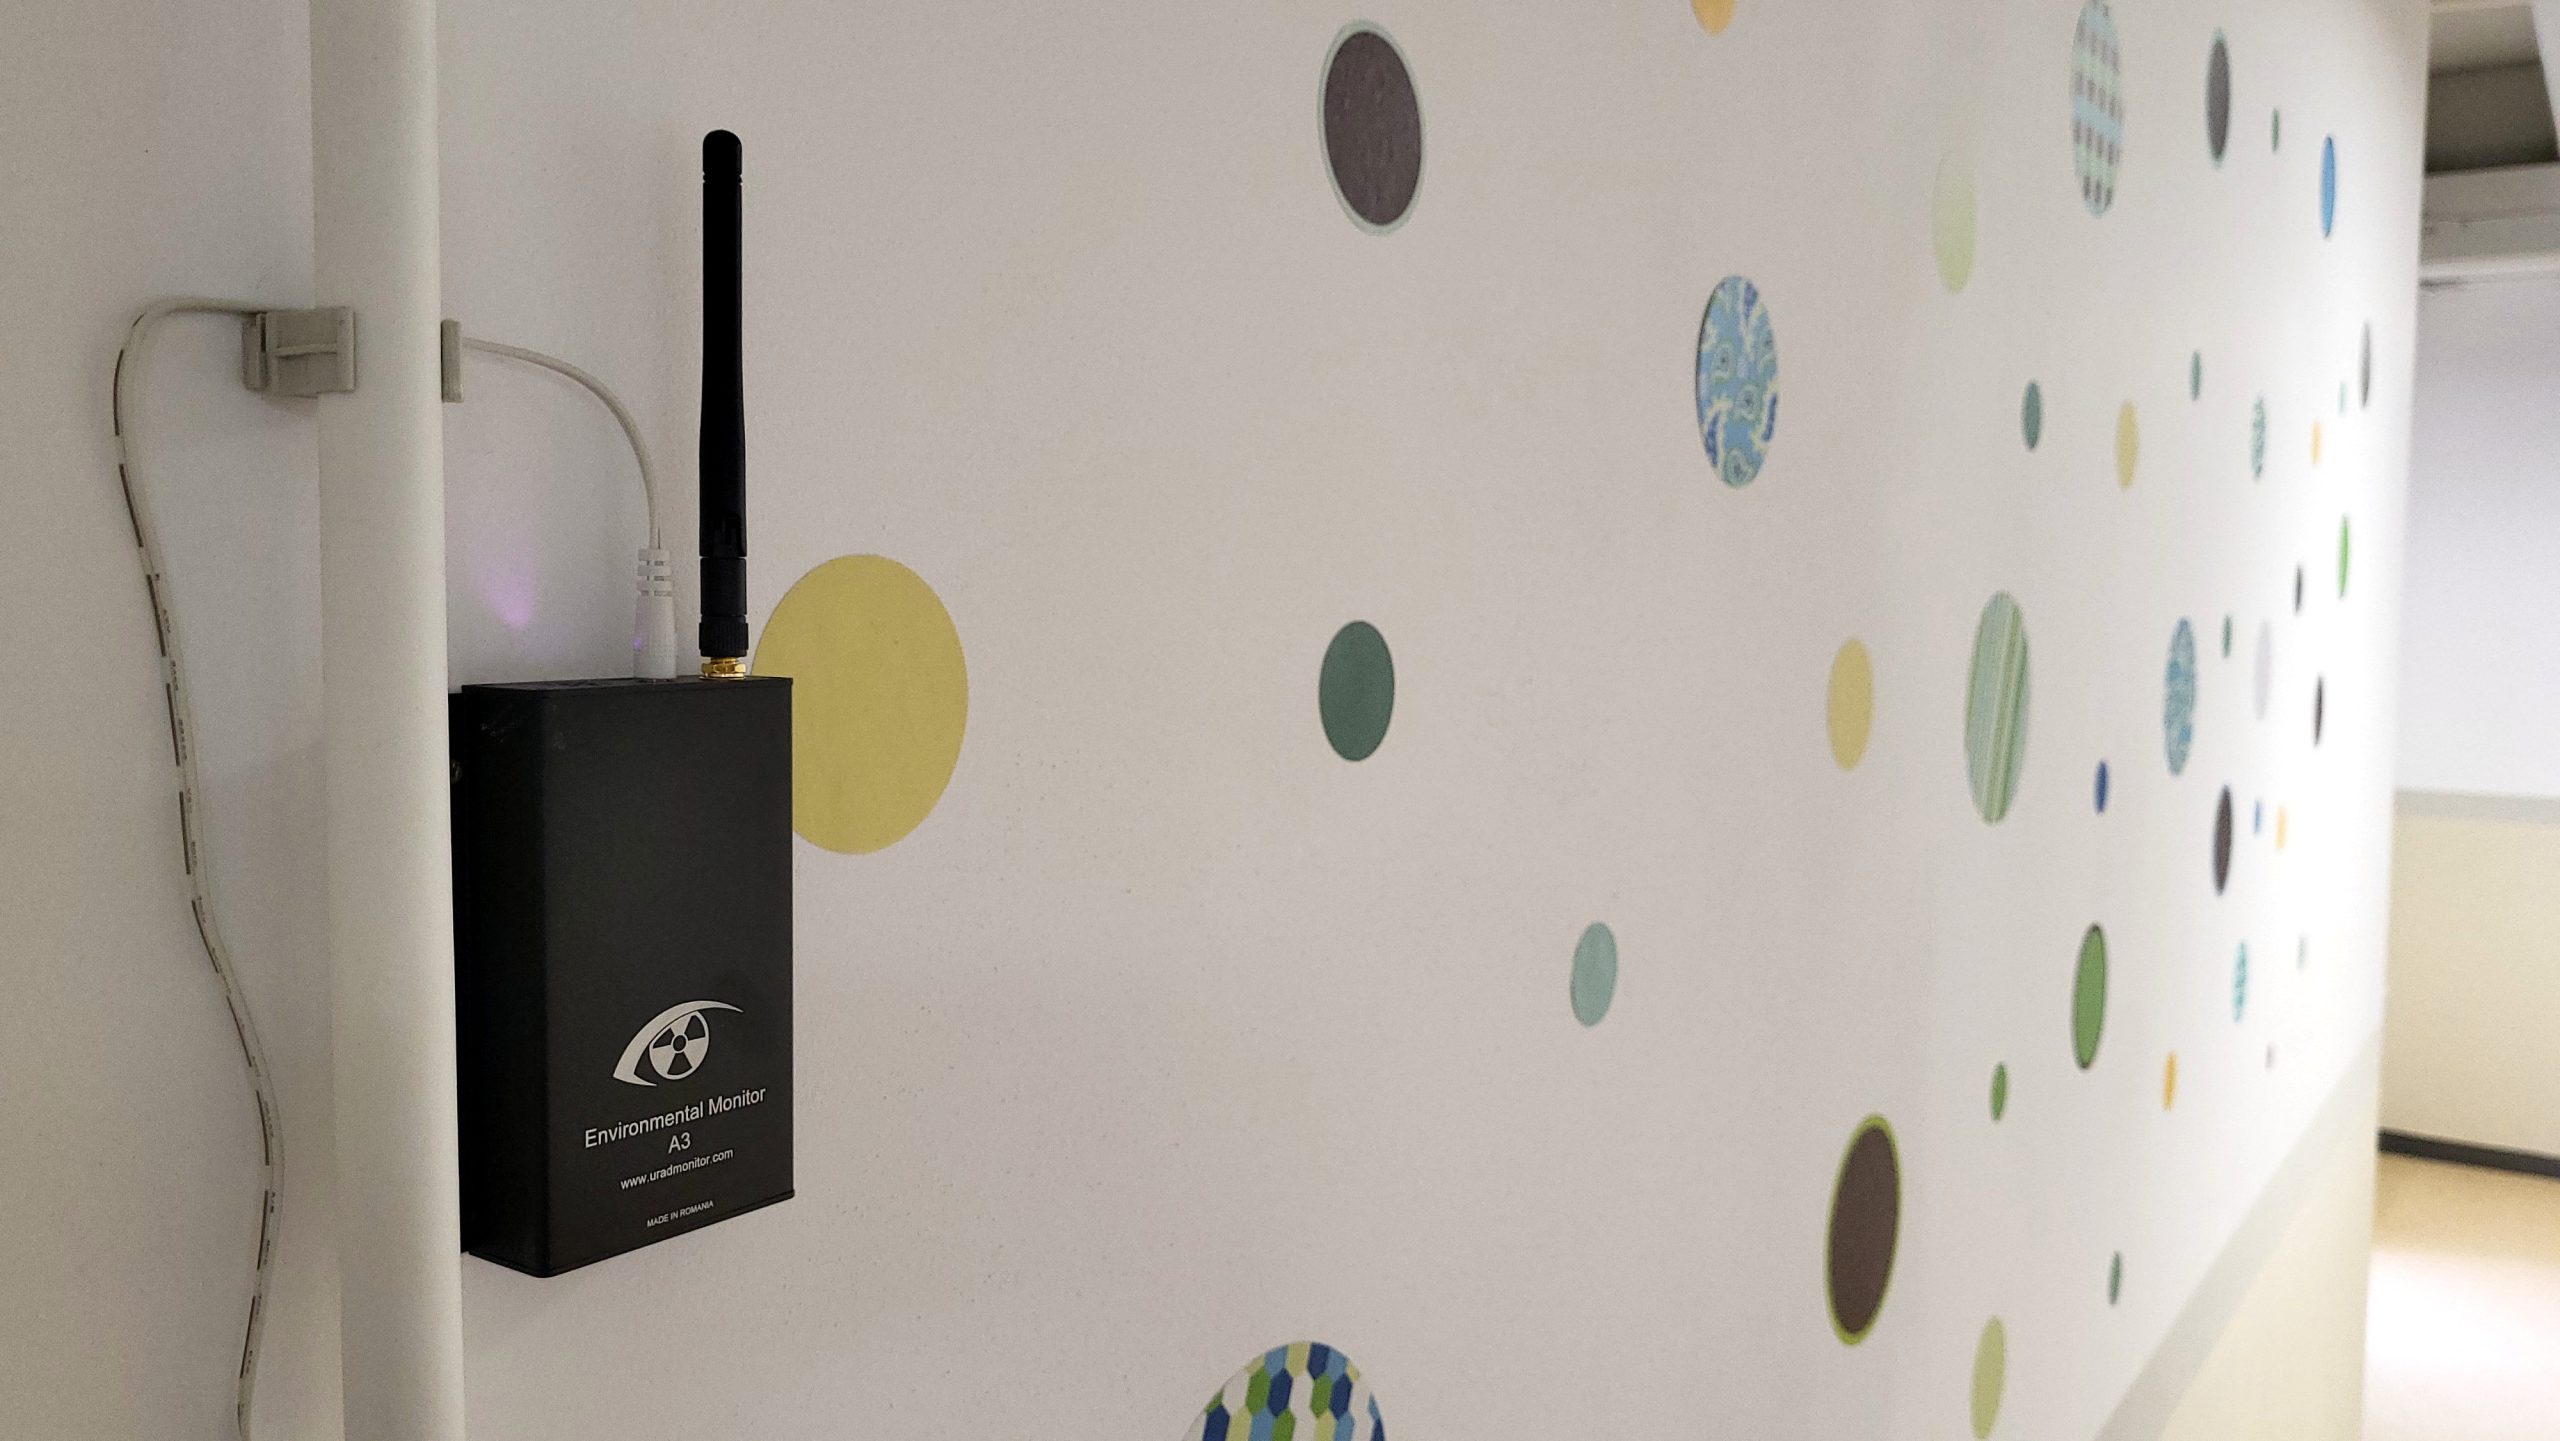
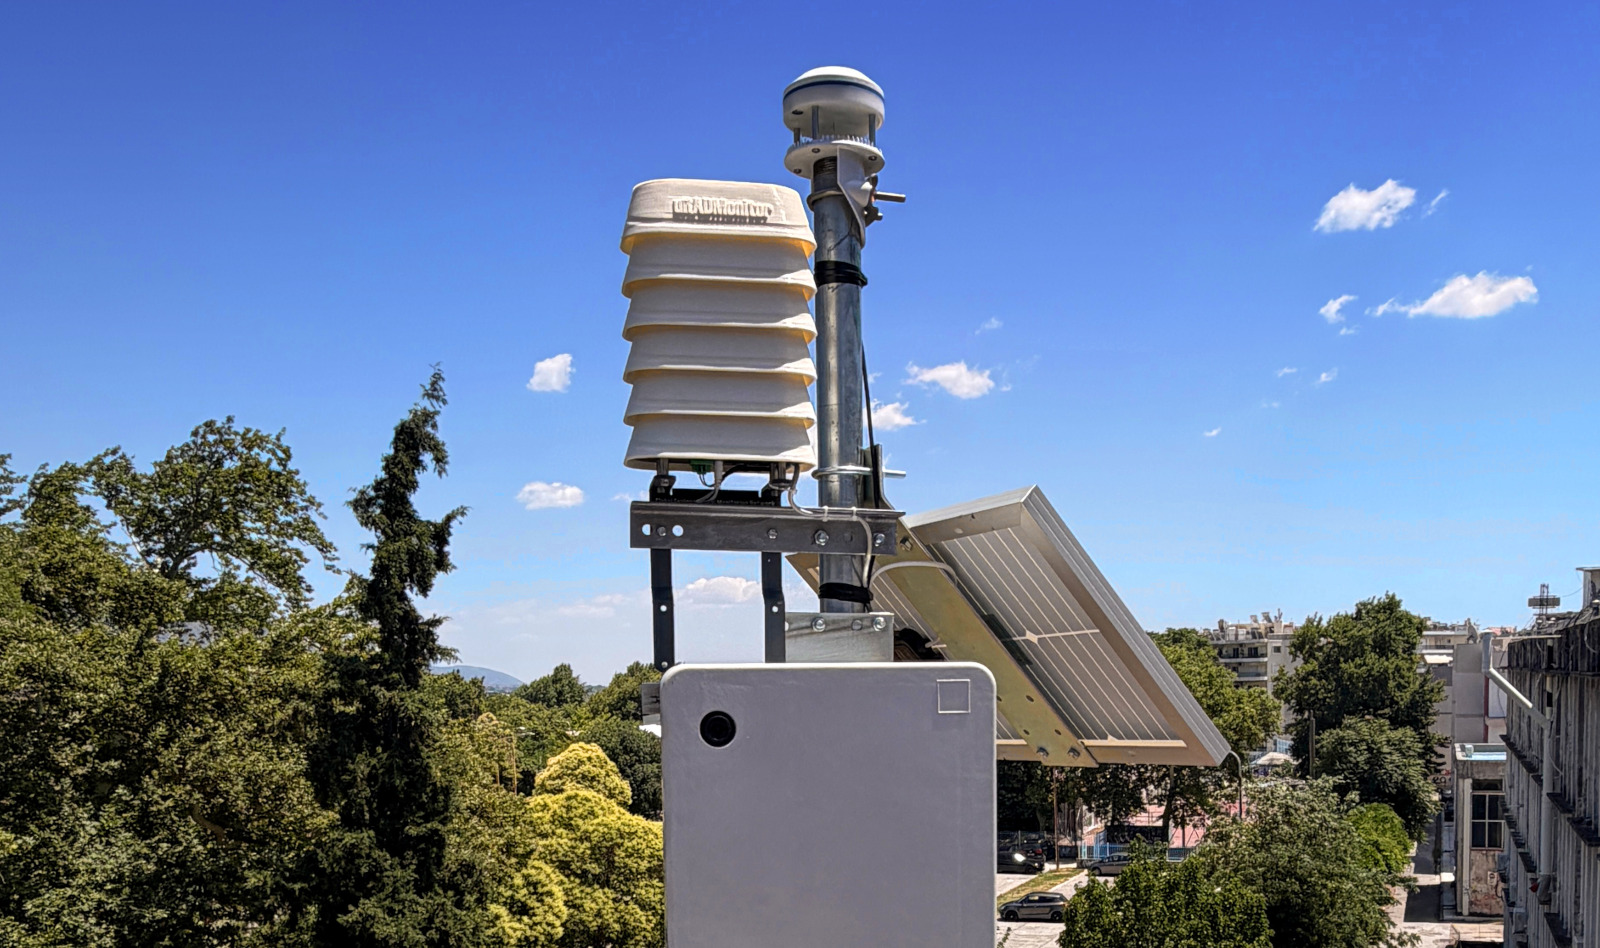
If there is no station near you, you can add one. MODEL A is a rainproof Geiger counter station that reports online every minute and appears on the public map. Or if you have the technical skills, you can build an open source uRADMonitor KIT1. Your readings help everyone in your area.
Radiation values on uRADMonitor are estimates derived from Geiger counter readings. They are indicative and not a substitute for official monitoring.
Liked this? Get monthly air quality findings.
One email a month from the uRADMonitor network. Unsubscribe anytime.

codemore code
~~~~