
Introduction
The goal of this project was to bring data from two different measuring devices I use into the uRADMonitor network: a GQ RadonPro for measuring radon concentration and ionizing radiation, and an AirGradient Open Air O-1PST for monitoring outdoor air quality.
Both devices are connected to Home Assistant, which made it a natural bridge between the individual sensors and the uRADMonitor network.
GQ RadonPro + AirGradient → Home Assistant → uRADMonitor EXP Protocol → uRADMonitor Network
Now, with a single uRADMonitor device, I can now monitor radon, radiation, temperature, relative humidity, CO₂, PM1, PM2.5 and PM10.
GQ RadonPro
The GQ RadonPro can monitor radon concentration and ionizing radiation at the same time. In my setup, Home Assistant receives, among other values, CPM (counts per minute) for radiation monitoring and the radon concentration in pCi/L.
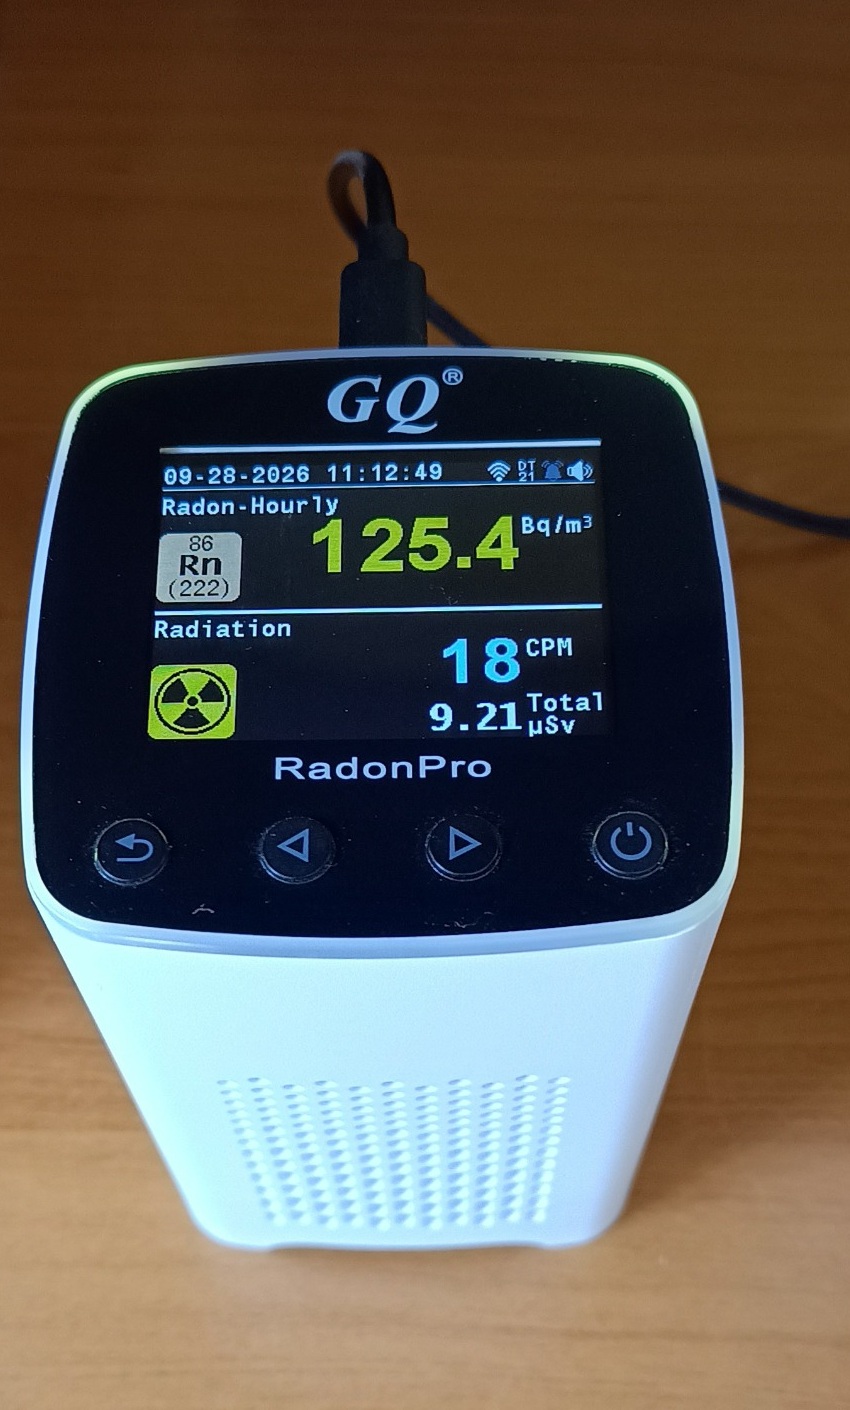
The GQ RadonPro used in this project. The display shows both radon and radiation in CPM.
Getting RadonPro Data into Home Assistant
RadonPro sends its data to the GMC service, and Home Assistant then retrieves it using a REST sensor. In this public example, the device parameter ID has been replaced with a placeholder.
rest:
  - resource: "https://www.gmcmap.com/historyData.asp?Param_ID=YOUR_PARAMETER_ID"
    scan_interval: 300
    headers:
      User-Agent: "Mozilla/5.0 (Windows NT 10.0; Win64; x64)"
    sensor:
      - name: "RadonPro GMC Data"
        value_template: >
          {% set raw = value | regex_findall('<td>([^<]+)</td>') %}
          {% if raw | length >= 8 %}
            {{ raw[0] }}|{{ raw[1] }}|{{ raw[2] }}|{{ raw[3] }}|{{ raw[4] }}
          {% else %}
            unavailable
          {% endif %}
From the retrieved data, I then create individual sensors in Home Assistant:
template:
  - sensor:
      - name: "RadonPro uSv/h"
        state: >
          {% set d = states('sensor.radonpro_gmc_data').split('|') %}
          {{ d[4] | trim if d | length >= 5 else 'unavailable' }}
        unit_of_measurement: "µSv/h"

      - name: "RadonPro CPM"
        state: >
          {% set d = states('sensor.radonpro_gmc_data').split('|') %}
          {{ d[2] | trim if d | length >= 5 else 'unavailable' }}
        unit_of_measurement: "CPM"

      - name: "RadonPro ACPM"
        state: >
          {% set d = states('sensor.radonpro_gmc_data').split('|') %}
          {{ d[3] | trim if d | length >= 5 else 'unavailable' }}
        unit_of_measurement: "CPM"

      - name: "RadonPro pCi/L"
        state: >
          {% set d = states('sensor.radonpro_gmc_data').split('|') %}
          {{ d[1] | trim if d | length >= 5 else 'unavailable' }}
        unit_of_measurement: "pCi/L"
Converting Radon from pCi/L to Bq/m³
RadonPro provides the radon concentration in pCi/L, while uRADMonitor expects this parameter in Bq/m³. A conversion is therefore required before uploading: 1 pCi/L = 37 Bq/m³. For example, 2.03 pCi/L × 37 = 75.11 Bq/m³. Home Assistant performs this conversion automatically with every upload.
AirGradient Open Air
The second device is an AirGradient Open Air O-1PST, which I use to monitor outdoor air quality. From AirGradient, Home Assistant receives temperature, relative humidity, CO₂, PM1, PM2.5 and PM10.
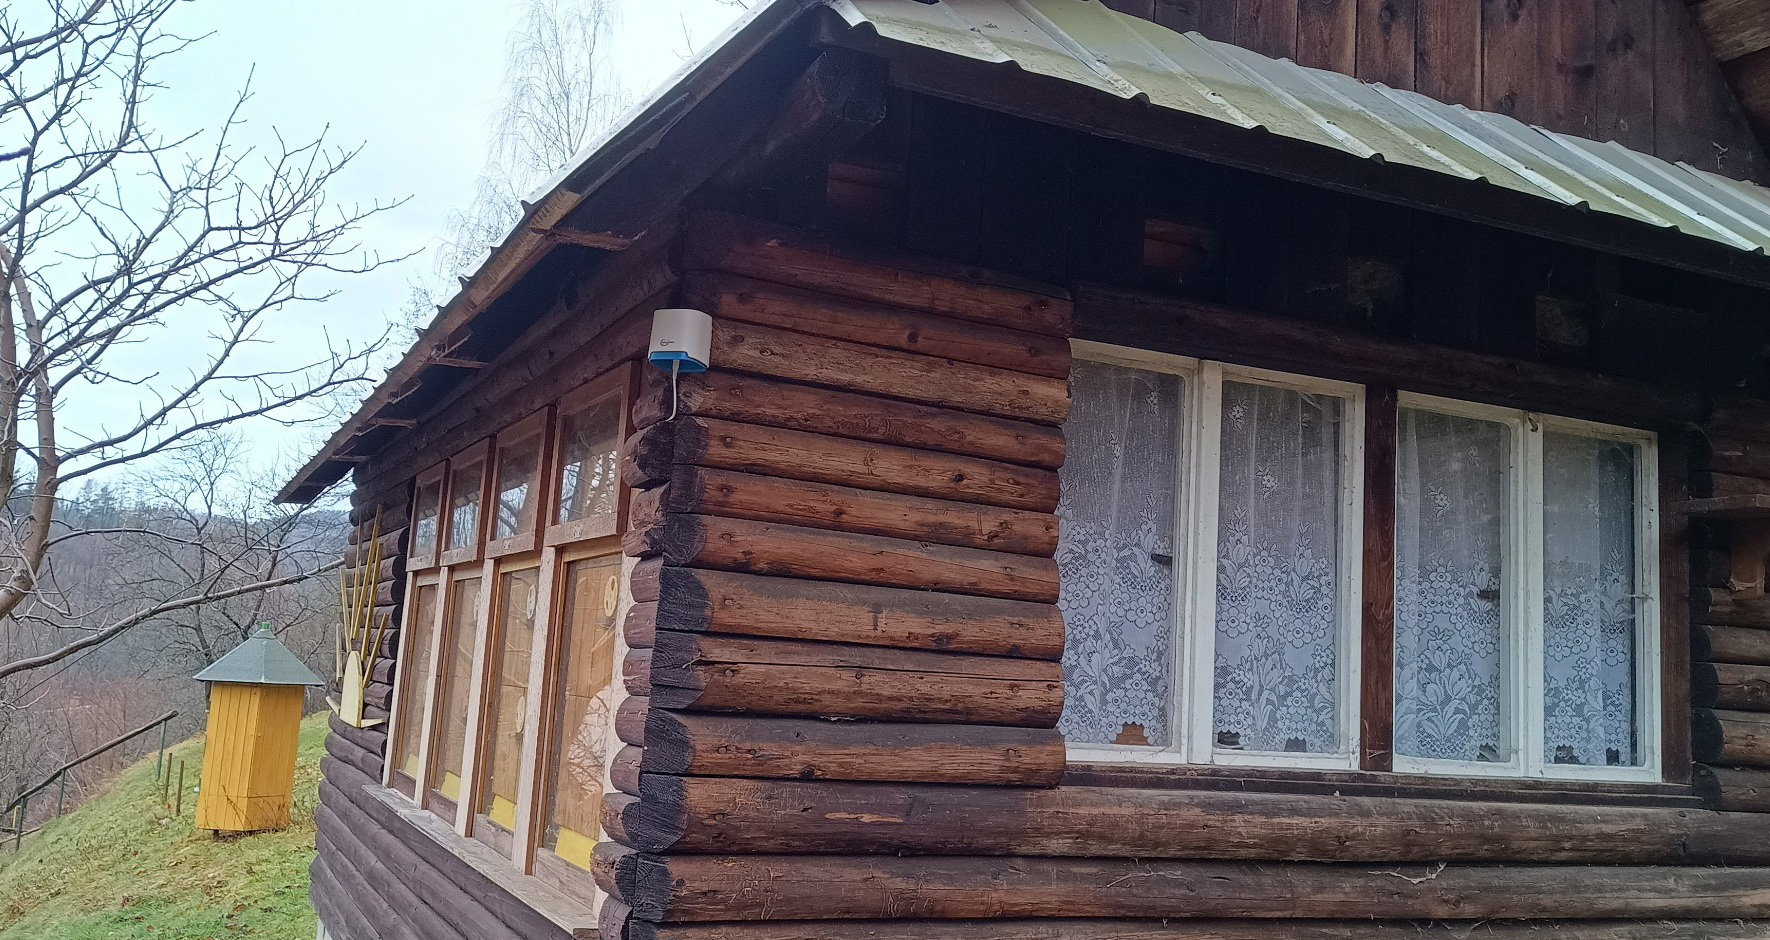
AirGradient Open Air O-1PST at the actual measurement location on the apiary building in Brňov, Czech Republic.
Home Assistant as the Central Hub and field mapping: what goes where
Home Assistant acts as the central bridge in the whole system. It receives radon and radiation data from RadonPro and air-quality data from AirGradient. It then combines the selected values into a single request for uRADMonitor. The table below shows which parameter from each device maps to which EXP protocol field uploaded to uRADMonitor. Documentation on that here.
| Source | Measurement | EXP field |
|---|---|---|
| AirGradient | Temperature | 02 |
| AirGradient | Relative humidity | 04 |
| AirGradient | CO₂ | 07 |
| AirGradient | PM2.5 | 09 |
| GQ RadonPro | Radiation / CPM | 0B |
| AirGradient | PM1 | 12 |
| AirGradient | PM10 | 13 |
| GQ RadonPro | Radon | 15 |
Note: I intentionally do not upload the AirGradient VOC Index as the uRADMonitor VOC field. AirGradient provides a relative index, while the corresponding EXP protocol field expects a different type of value.
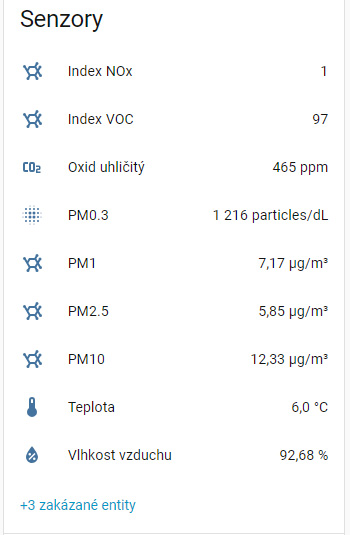
AirGradient in Home Assistant – individual sensors available for further processing.
Creating a uRADMonitor EXP Device with DIDAP
For my own data, I used a uRADMonitor EXP-class device. I store the access credentials in secrets.yaml rather than directly in the main configuration.
Real API keys and passwords should, of course, never be included in a publicly published article.
Uploading Data to uRADMonitor
In Home Assistant, I use a rest_command that builds a single request containing values from both devices:
rest_command:
  uradmonitor_submit:
    url: >-
      https://data.uradmonitor.com/api/v1/upload/exp/01/{{ now().timestamp() | int }}/02/{{ states('sensor.o_1pst_teplota') | float(0) | round(2) }}/04/{{ states('sensor.o_1pst_vlhkost_vzduchu') | float(0) | round(2) }}/07/{{ states('sensor.o_1pst_oxid_uhlicity') | int(0) }}/09/{{ states('sensor.o_1pst_pm2_5') | float(0) | round(2) }}/0B/{{ states('sensor.radonpro_cpm') | int(0) }}/12/{{ states('sensor.o_1pst_pm1') | float(0) | round(2) }}/13/{{ states('sensor.o_1pst_pm10') | float(0) | round(2) }}/15/{{ (states('sensor.radonpro_pci_l') | float(0) * 37) | round(2) }}
    method: POST
    headers:
      X-User-id: !secret urad_user_id
      X-User-hash: !secret urad_user_key
      X-Device-id: !secret urad_device_id
    timeout: 30
For the radon conversion, this part is essential:
Home Assistant takes the current value in pCi/L, multiplies it by 37, and sends the result to uRADMonitor in Bq/m³. The entity names in this example match my installation; other users should replace them with their own entity IDs.
Automatic Upload Every Five Minutes
alias: uRADMonitor
description: ""
triggers:
  - trigger: time_pattern
    minutes: "/5"
conditions: []
actions:
  - action: rest_command.uradmonitor_submit
    metadata: {}
    data: {}
mode: single
Home Assistant therefore sends the current values to uRADMonitor every five minutes. During a manual test, the server responded with “success: ok” and HTTP status code 200.
A Problem I Encountered
When setting up an EXP device, parameters reported from the very first upload are recognised and activated automatically by the uRADMonitor server. However, if new parameters are added to an existing device at a later stage, they may not appear on the dashboard until they are manually enabled server-side. If measurements are uploading successfully (HTTP 200, “success: ok”) but not appearing in the history, contact uRADMonitor support with your device ID.
During the first tests, uploading worked correctly and uRADMonitor returned a successful response. Radiation was displayed, but radon did not appear in the history. The problem was not the conversion or Home Assistant. After I contacted uRADMonitor, Radu found that radon display had not been enabled server-side for my EXP unit. Once it was enabled, the values started appearing correctly.
A similar situation occurred later when I added more measurements from AirGradient. uRADMonitor normally recognizes parameters automatically when a sensor reports them from the beginning. However, if new parameters are added to an existing device later, manual activation may be required. I would like to thank Radu Motișan for his quick help in resolving both situations.
Ecowitt GW1100 Weather Station
The third data source in this setup is an Ecowitt GW1100 wireless weather station gateway, which extends the station’s coverage into meteorological parameters. Through Home Assistant, it contributes wind speed, wind direction, rain accumulation, solar irradiance and illuminance to the uRADMonitor upload. These parameters map to the corresponding EXP protocol fields and appear live on the station dashboard alongside the radiological and air quality data from the other two devices.
GQ RadonPro → Home Assistant → uRADMonitor EXP
AirGradient Open Air → Home Assistant → uRADMonitor EXP
Ecowitt GW1100 → Home Assistant → uRADMonitor EXP
The addition of the Ecowitt brings the total to 14 active parameters on station 13000204, making it one of the most comprehensive single-station setups on the uRADMonitor network. The combination is unusual: most stations focus either on air quality or on radiation. Having radon, ionizing radiation, particulate matter, CO2 and full weather data in one unified view, all sourced from three independent devices through a single Home Assistant bridge, is a direct result of the flexibility of the EXP protocol and the open architecture of the uRADMonitor network.
Result
The final dashboard combines data from two different physical devices. uRADMonitor now displays Temperature, Humidity, Carbon Dioxide, PM1.0, PM2.5, PM10, Radiation and Radon but also the weather data.
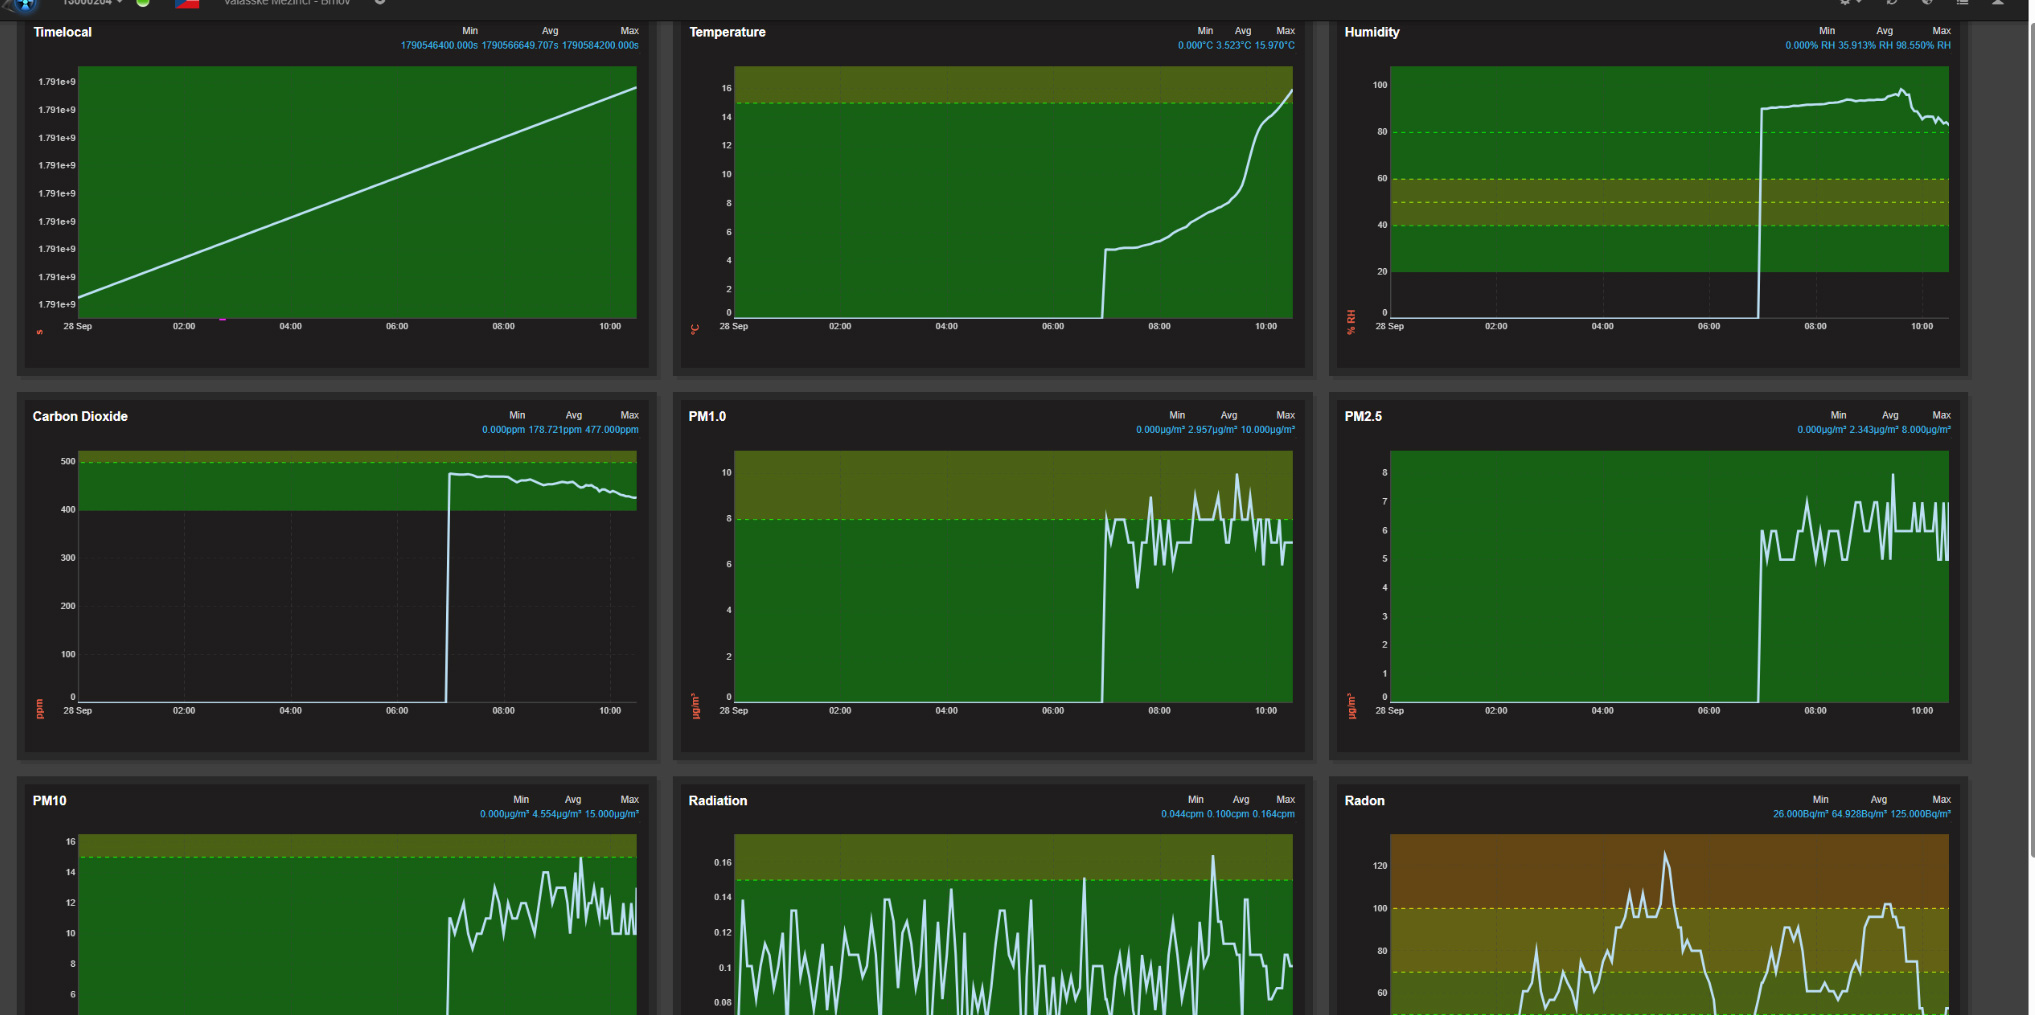
The resulting uRADMonitor dashboard with data from GQ RadonPro and AirGradient plus Ecowitt weather data
Conclusion
This project shows that Home Assistant can work very well as a universal bridge between different environmental sensors and the open uRADMonitor network. A device does not need to be designed specifically for direct uRADMonitor communication. If its data can be brought into Home Assistant, it can be processed, converted into the required units, and uploaded through the EXP protocol.
In my case, a single uRADMonitor station now combines measurements of radon, ionizing radiation and outdoor air quality. I hope this approach will also help other users of GQ RadonPro, AirGradient, Ecowitt or Home Assistant who would like to make their measurements available through the uRADMonitor network.
My thanks to Radu Motișan and the uRADMonitor community for their help and for making it possible to connect custom devices through the EXP protocol. The EXP protocol field list is documented at uradmonitor.com/open-data-upload-tutorial.
The Station on the Public uRADMonitor Map
The resulting EXP station 13000204 is also available on the public uRADMonitor network map. When radon is selected, the map shows the station’s current value and its detail panel with the graph and available measurements.
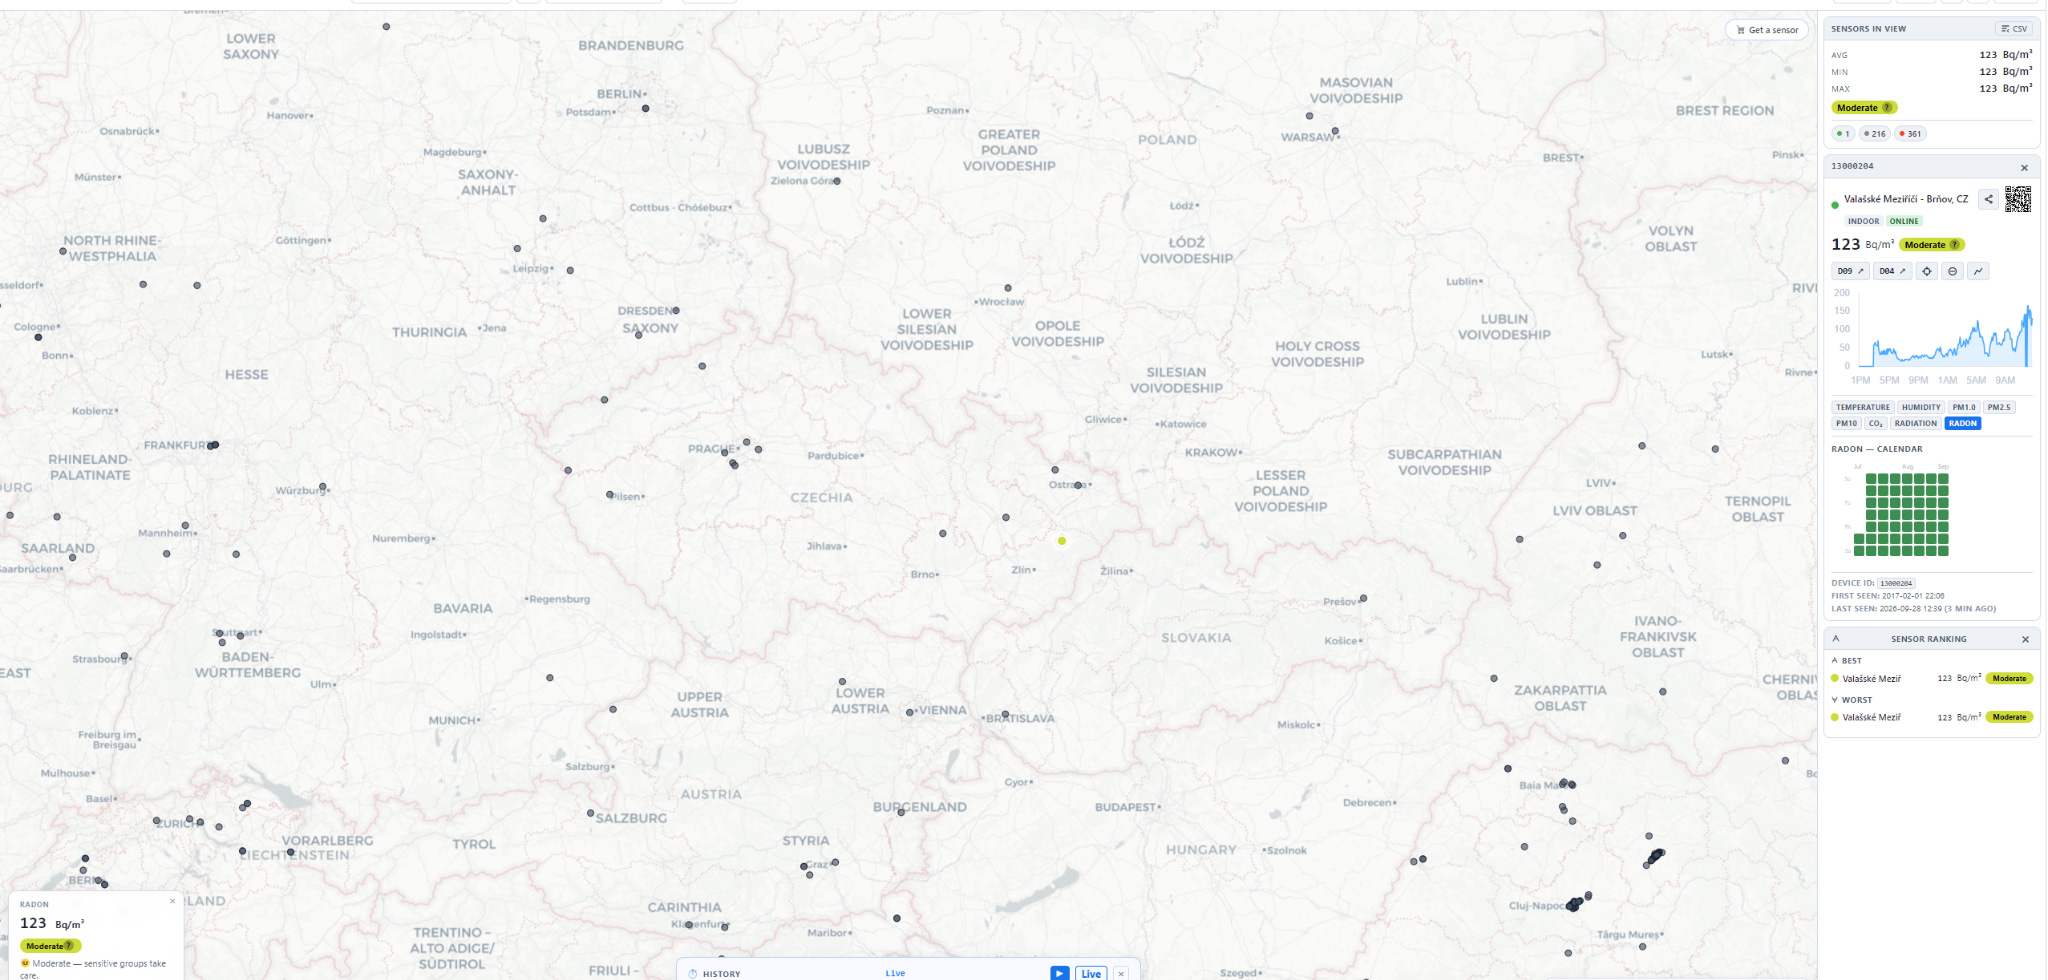
Station 13000204 on the public uRADMonitor network map, displaying radon concentration in Bq/m³.
uRADMonitor on a Global Scale
For broader context, the same data can also be viewed on the global uRADMonitor map. The following view keeps station 13000204 open in the right-hand panel while showing the distribution of monitoring stations around the world.
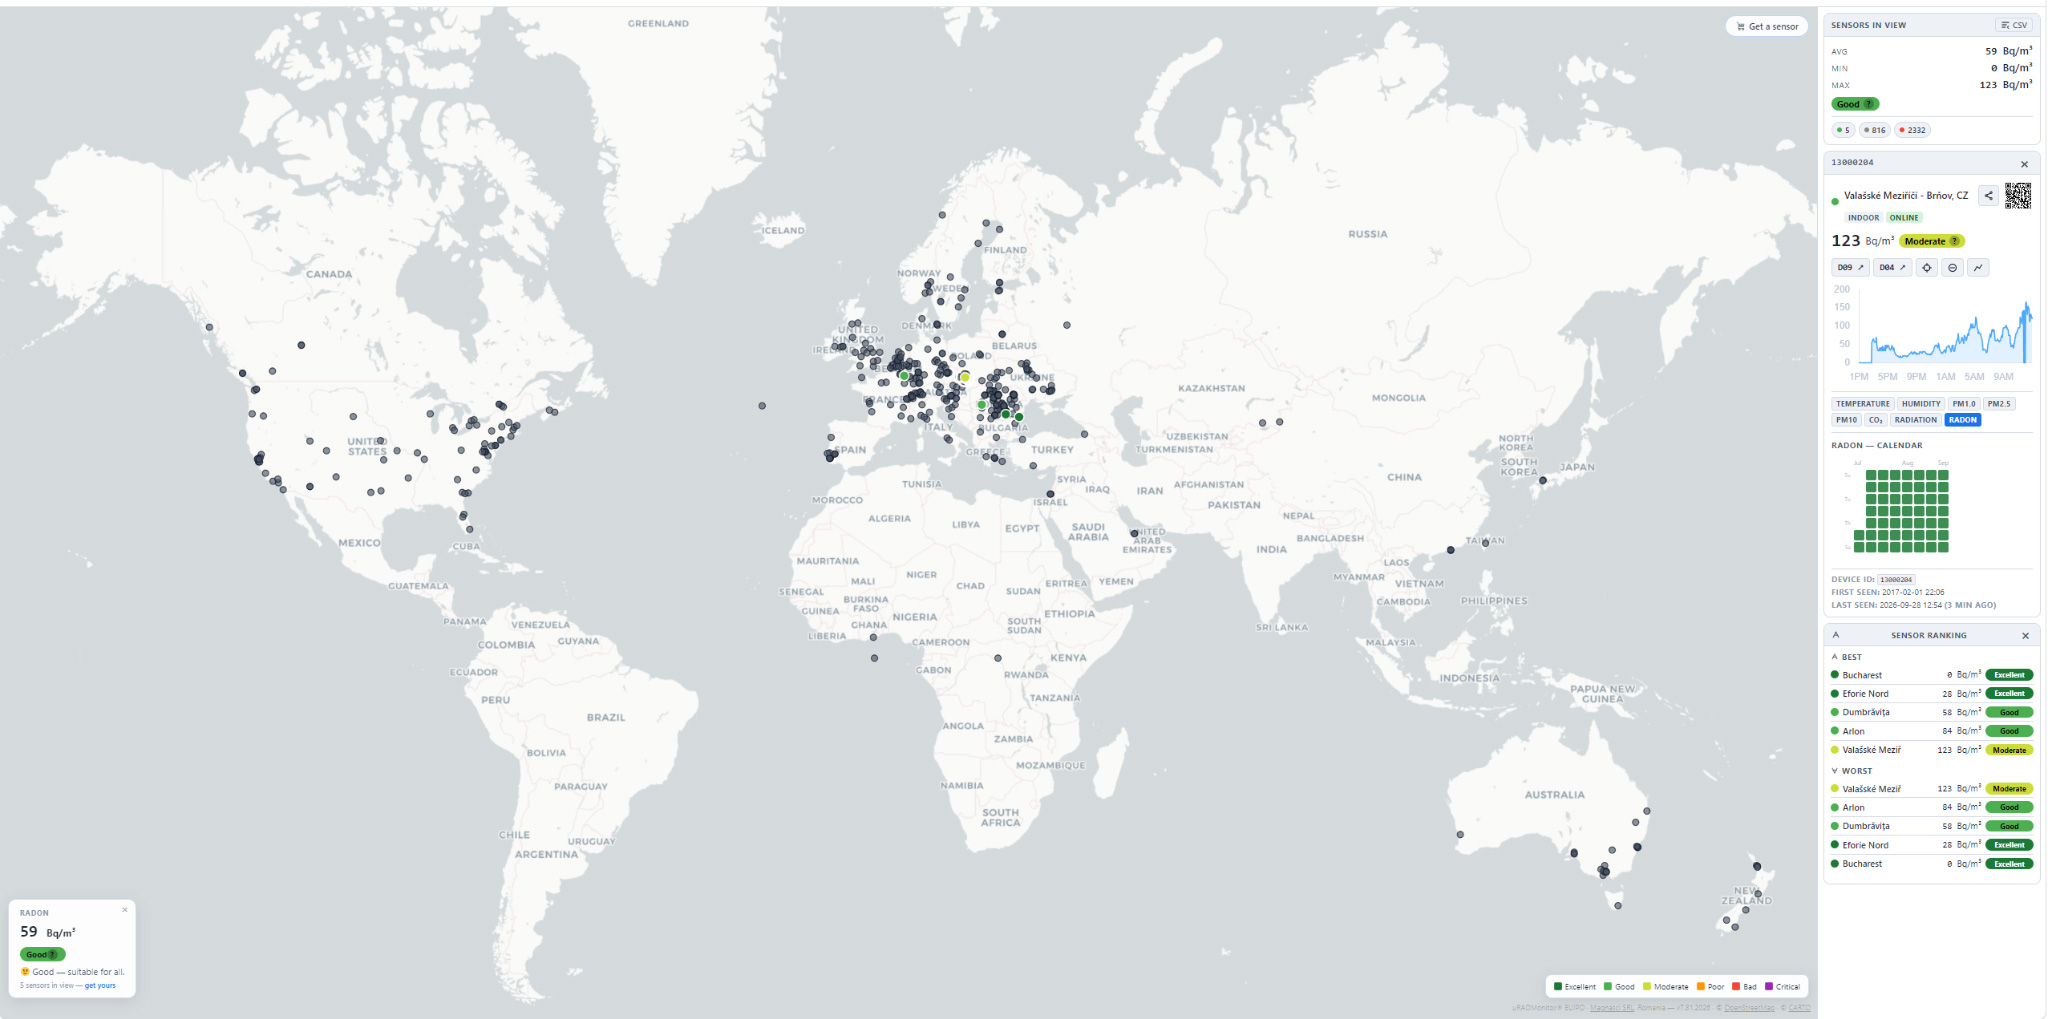
Global uRADMonitor map with EXP station 13000204 open in the side panel and radon selected.
The dedicated radon map shows stations with available radon measurements in a global view. It illustrates how a custom sensor setup can contribute to a shared, open environmental monitoring network.
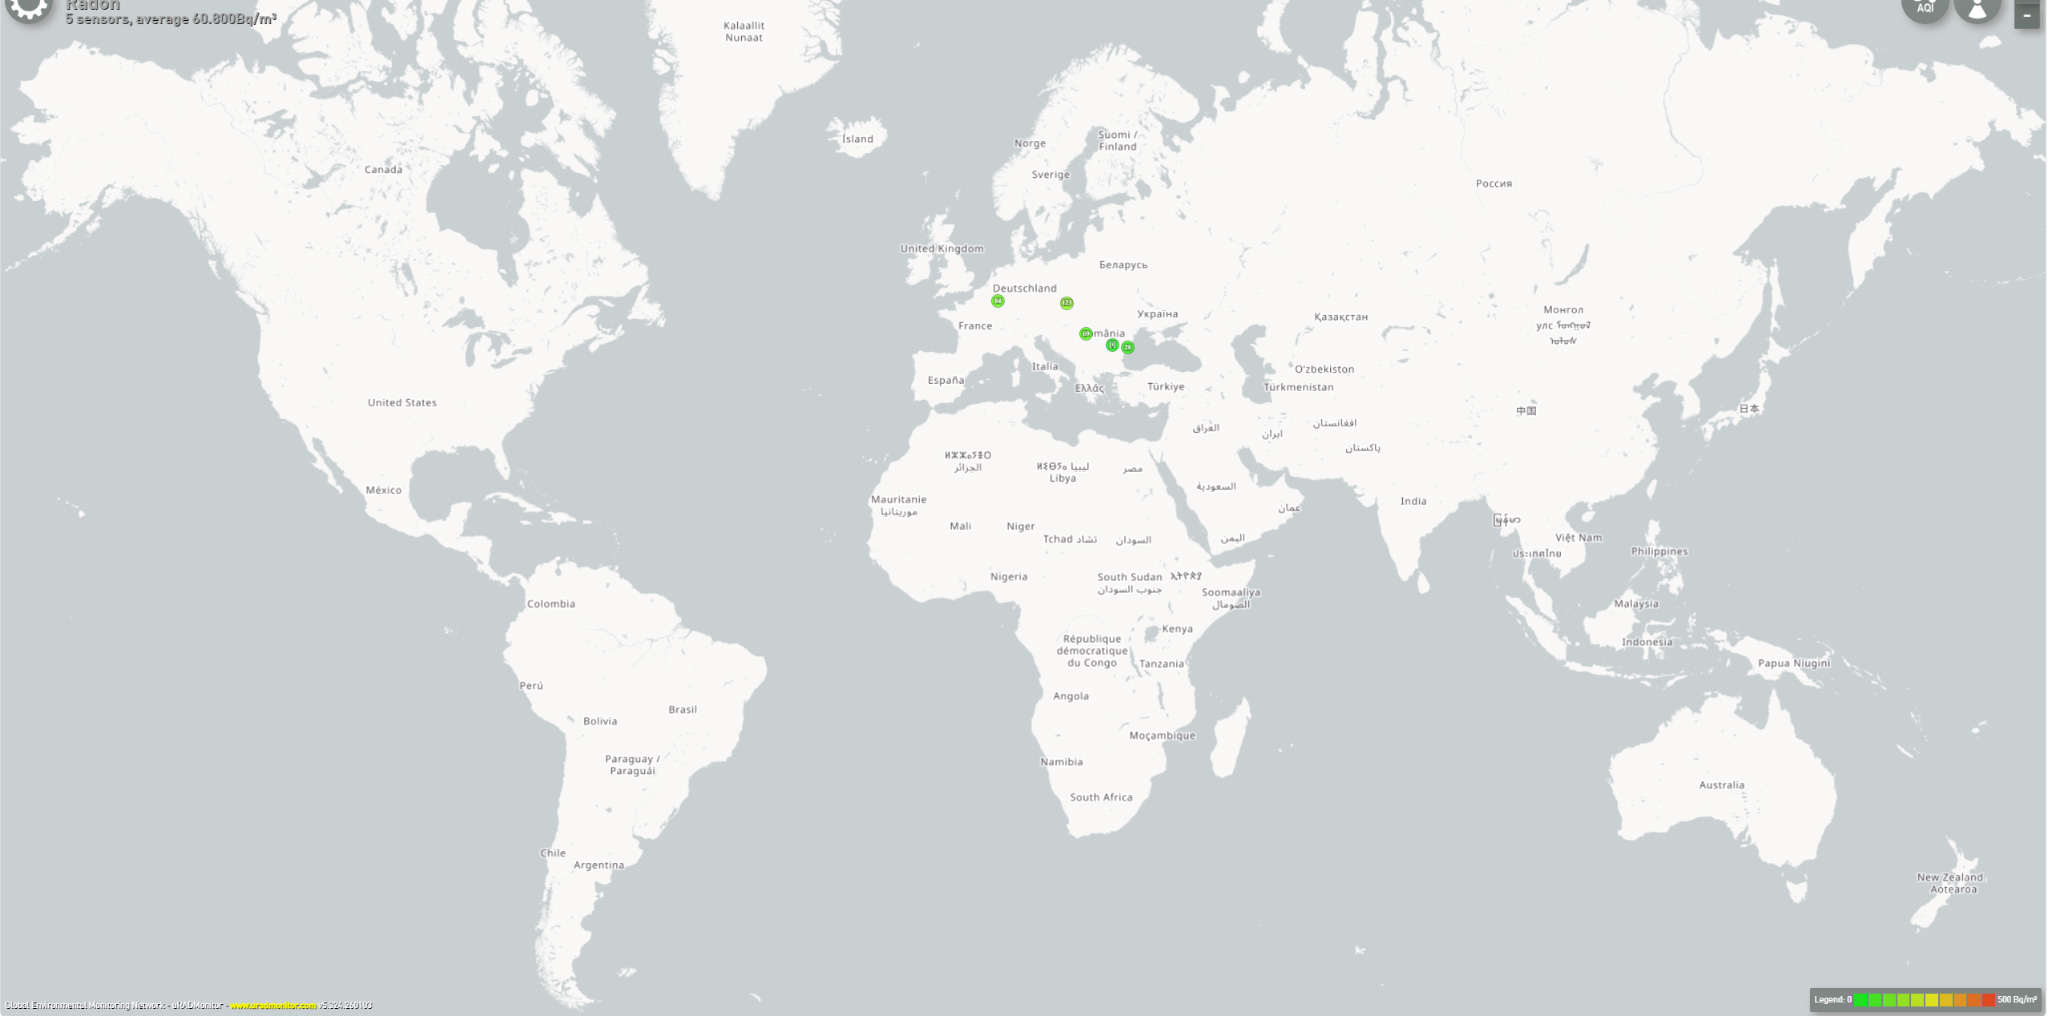
Global uRADMonitor radon map.
codemore code
~~~~