
Hi all,
Back in 2021 I started off with a very simple Heltec wifi kit 32 and since then I’ve been happily logging data using DIDAP (old method EXP1) protocol with a very basic interface and switched over to an Espressif ESP32 wrover-e with a little more advanced version thanks to it’s hardware specs and possibilities (e.g ADC counters) for actual moving average calculations.
Since the beginning of this year (2026) I’ve completely reworked my code with the help of AI, at first I was weary like many but I must admit it fixed a lot of issues I knew I had (and even those I didn’t). As for many it’s a juggle between family, work, home(work), renovations and mostly time. So I embraced it to help me better achieve my goals.
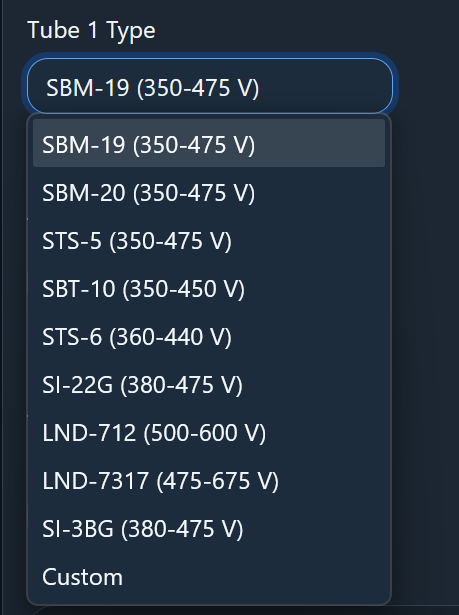
It improved hugely my dash-boarding, logging, math formulas, API integrations and even GM tube configurations. I was able to finally and correctly implement per tube data specifics such as the voltage ranges, uSv/h, (easy) and the most difficult of all the tube dead times.
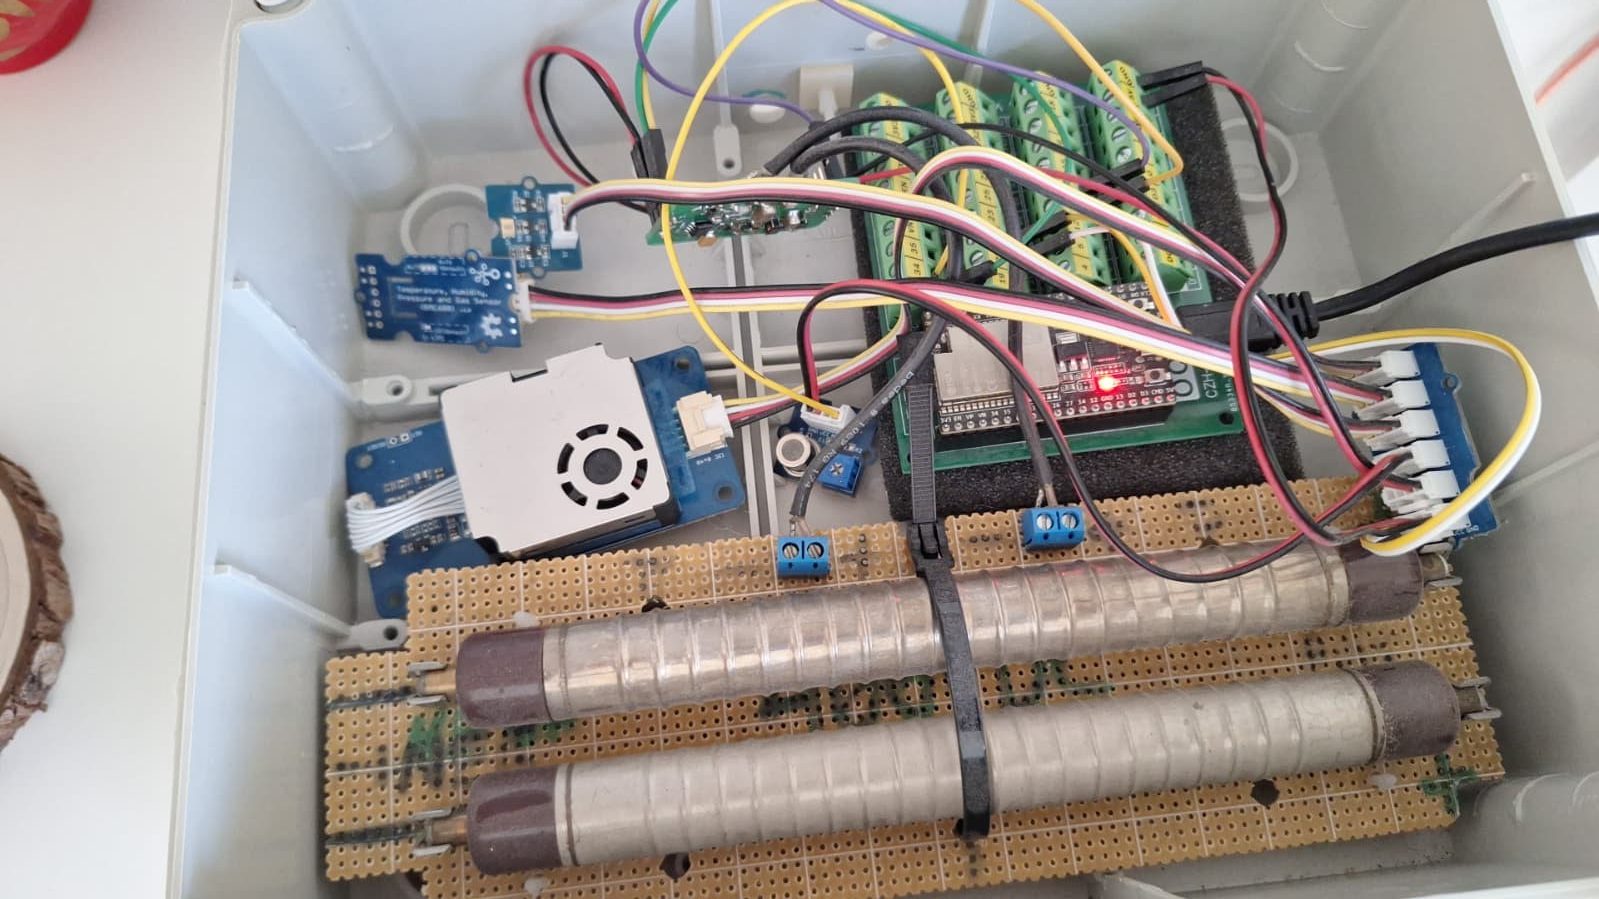
As you can see I use a dual tube setup, instead of placing the tubes in serial I use a RH electronics RH-K-GK-HV-4 that has 2 allows this set up, you get 2 nice outputs that I feed into 2 ADC’s on my ESP32. With this I can use a better moving average to smooth out my uploaded count and have higher graphing. Secondly I currently use a cheap PM1, 2.5 and 10 sensor, HCHO sensor, luminosity and BME680 sensor over I2C.
Radu asked me to create a little write up on how you can use the DIDAP (EXP) protocol yourselves
My main station:
https://www.uradmonitor.com/tools/dashboard-09/?open=13000212
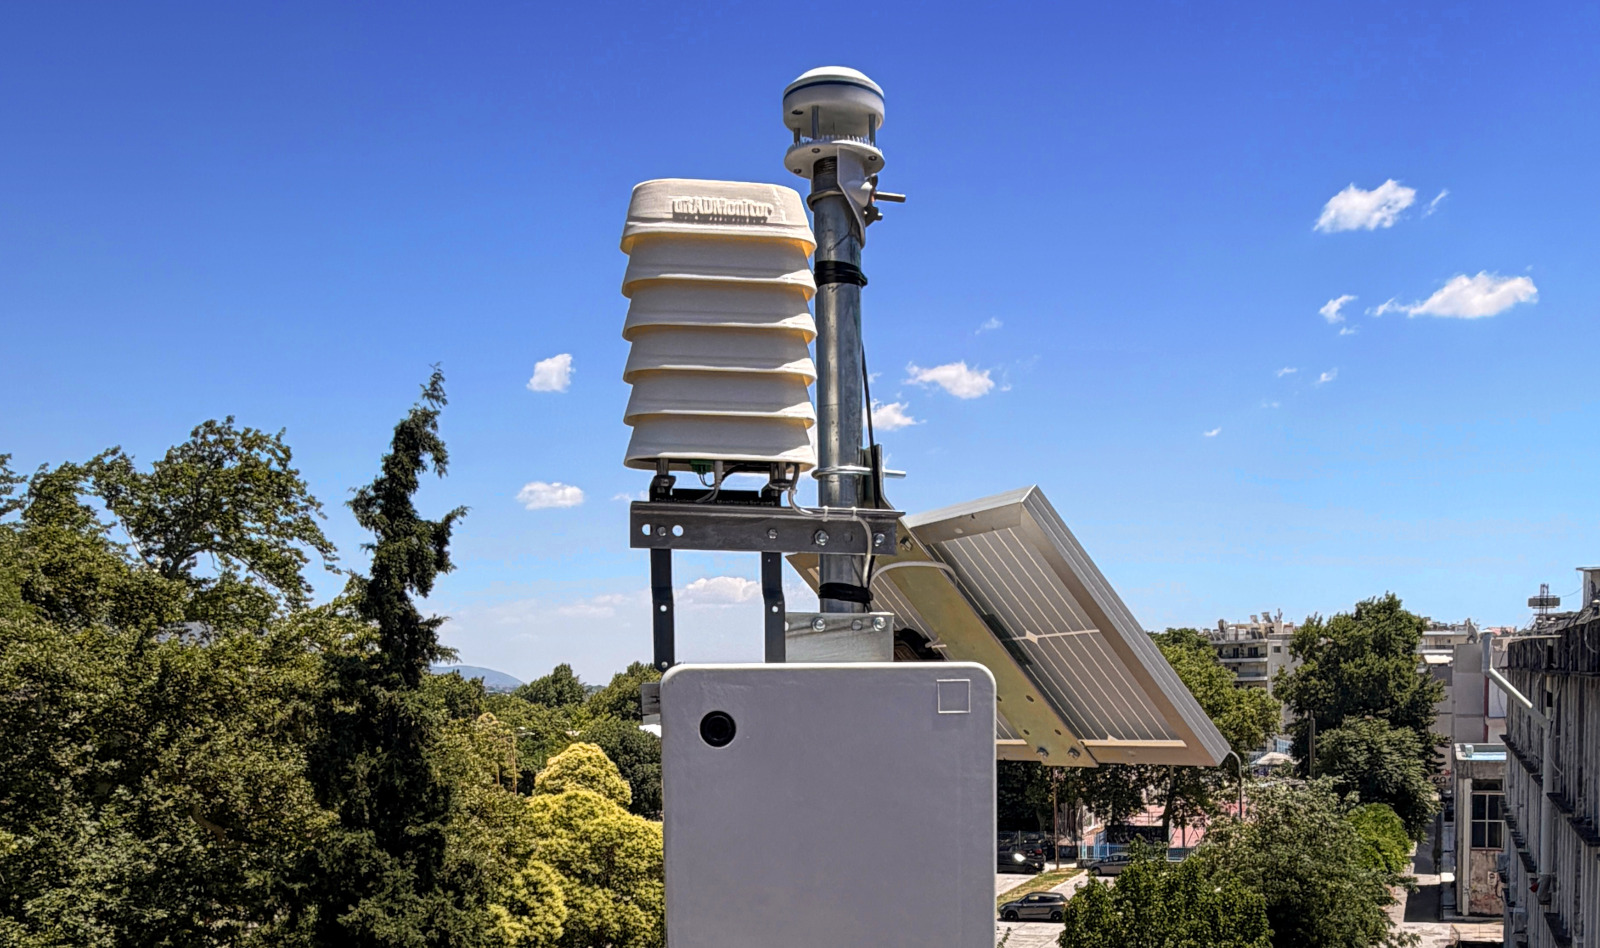
It currently looks very crude at the moment, as I didn’t had the time yet to look into a decent housing and mounting it ideally outside. Still weighing my options for POE vs wifi with a small power supply.
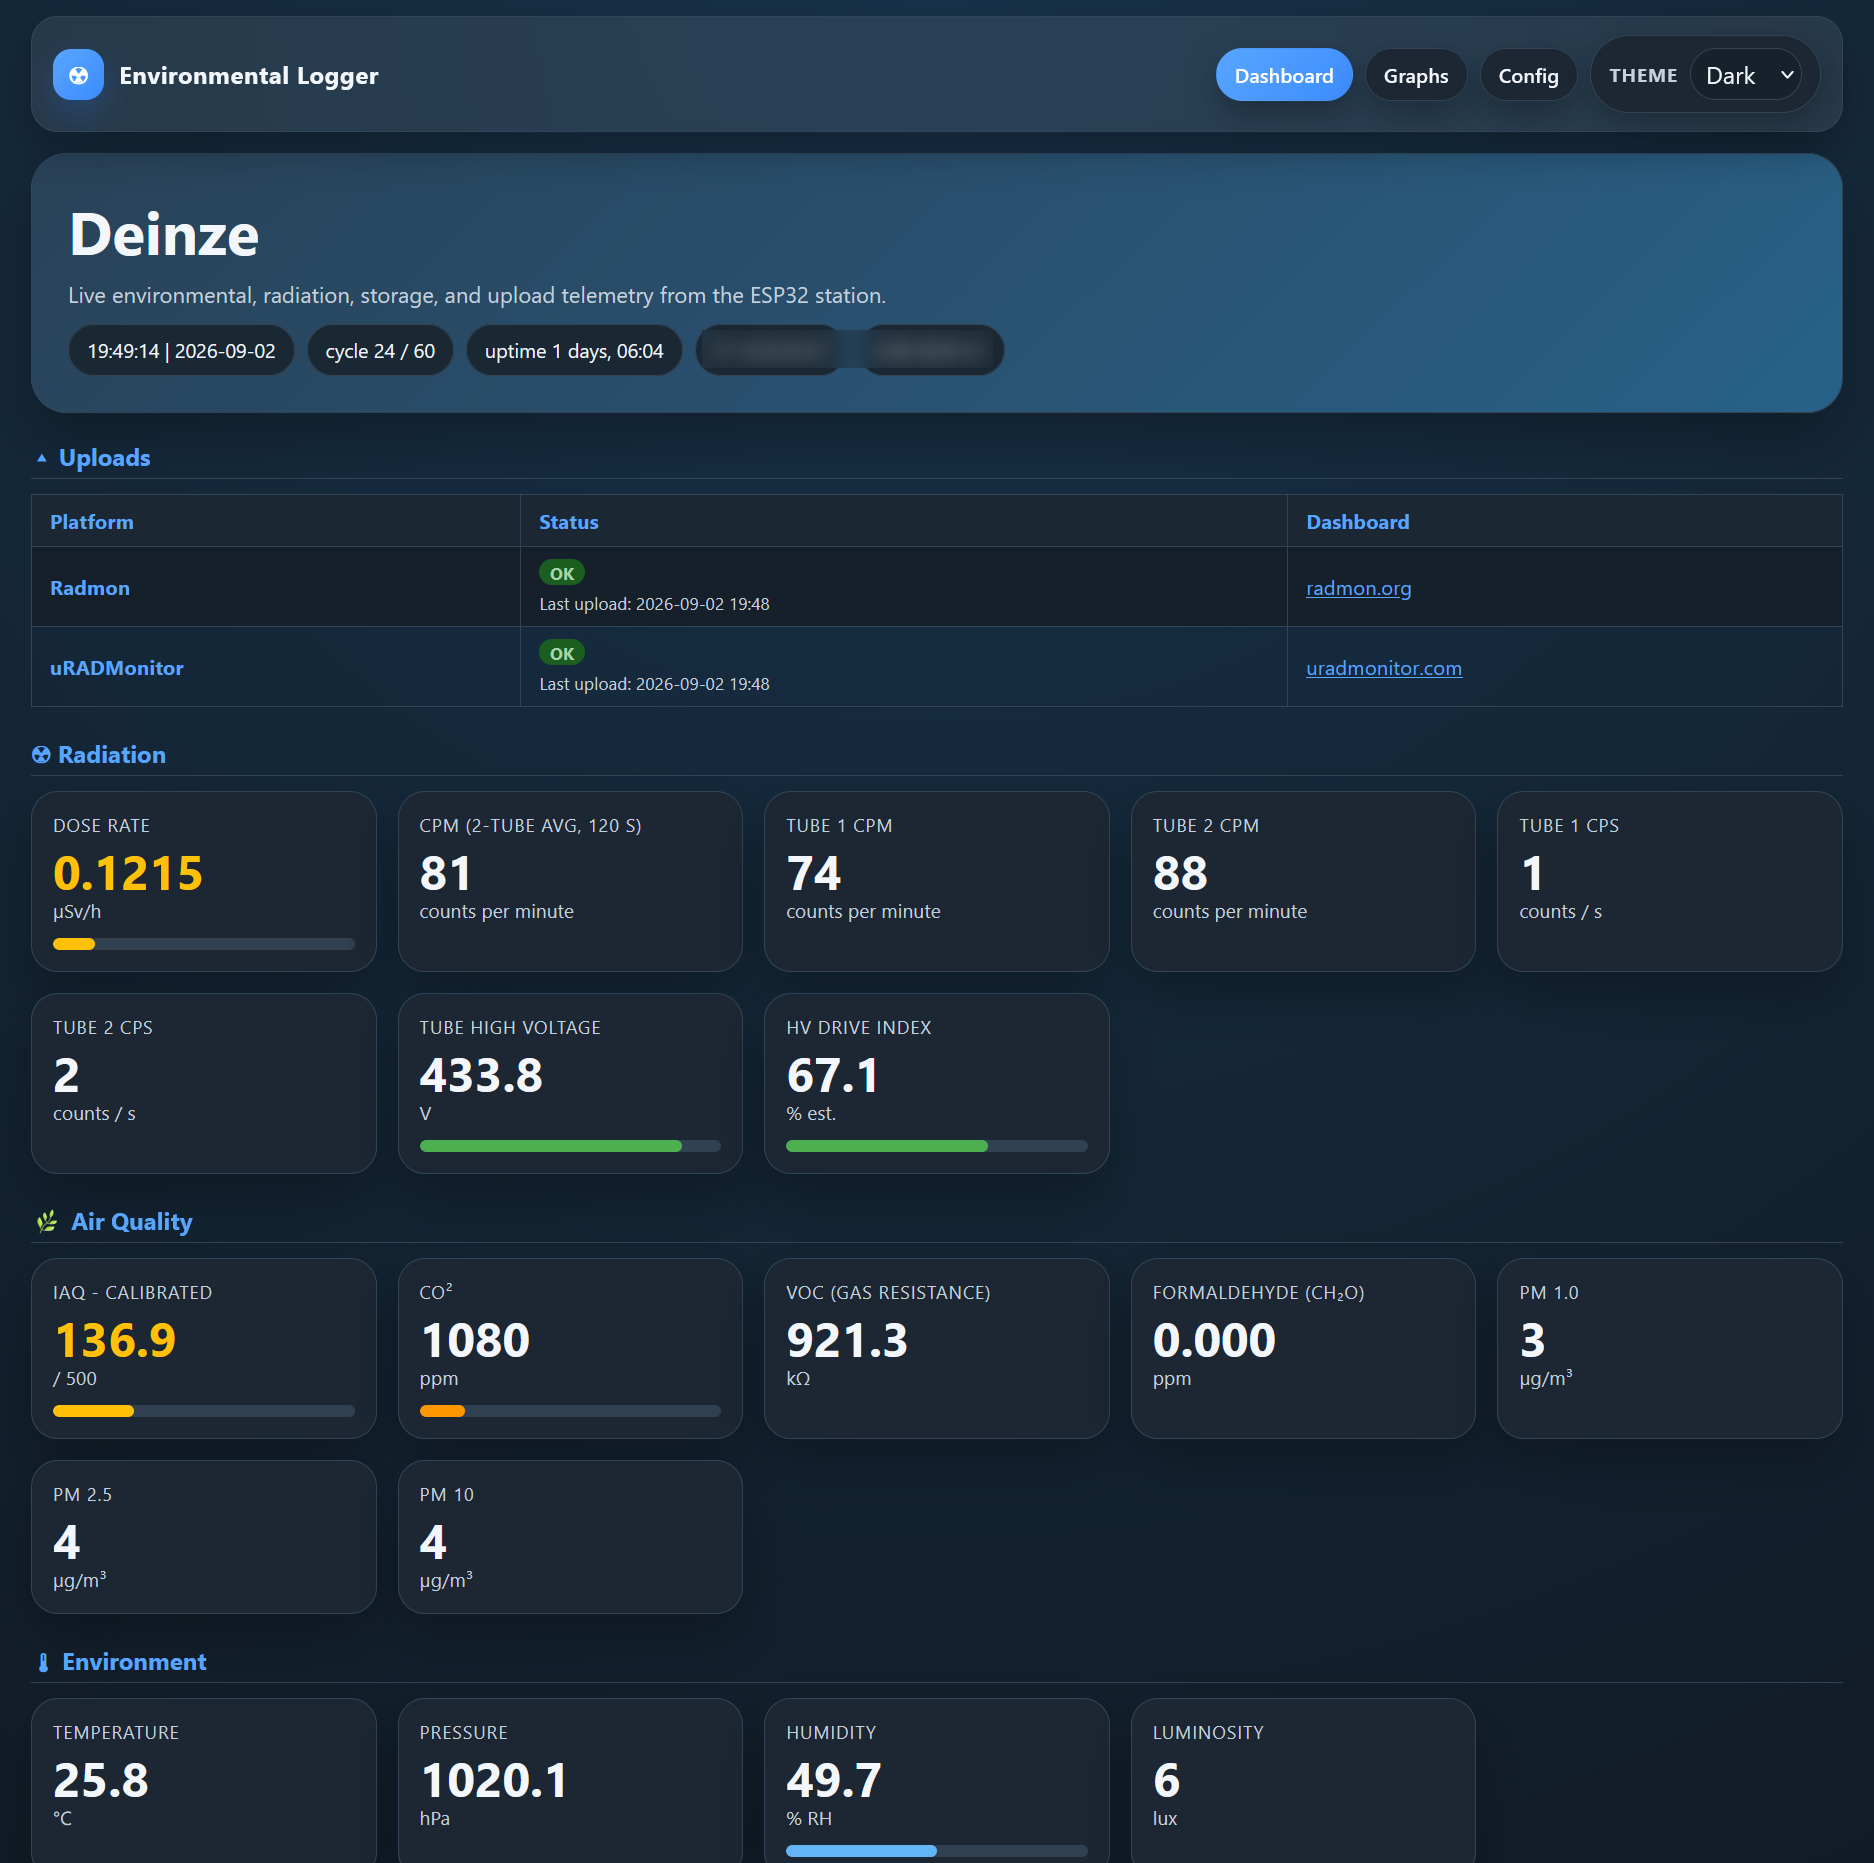
Dashboards
Main dashboard with all sensor overviews and upload status
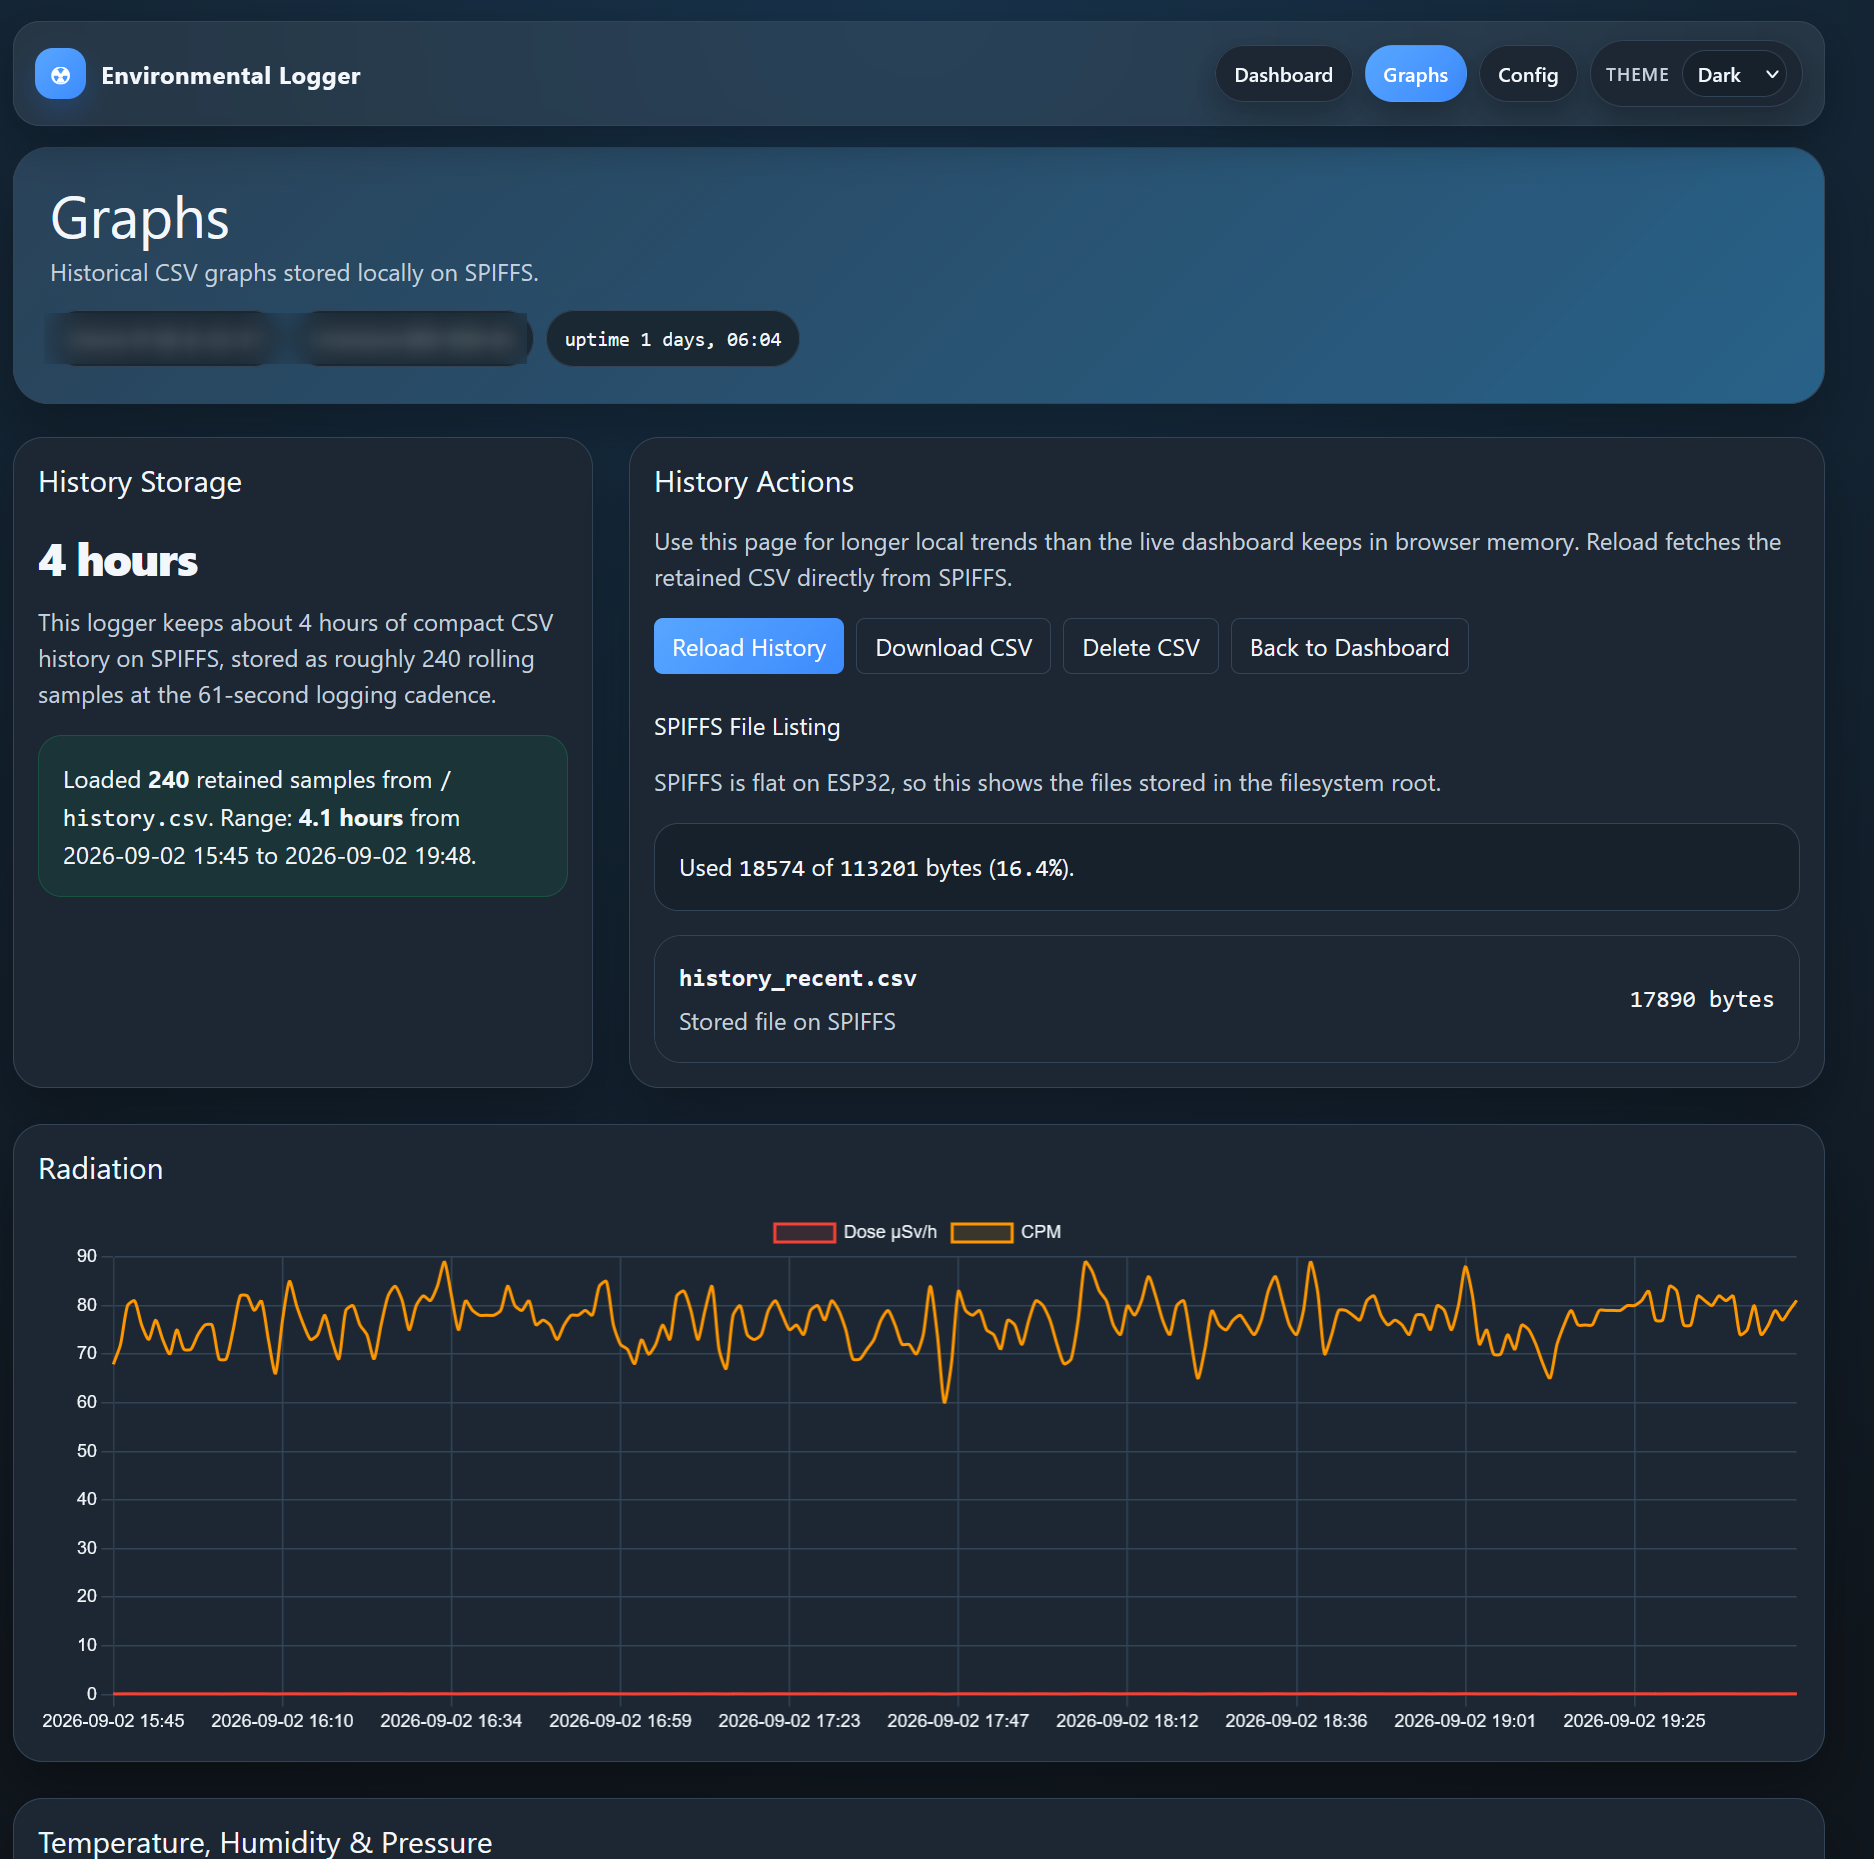
Historic graphing with log rotation that can be set from the config.
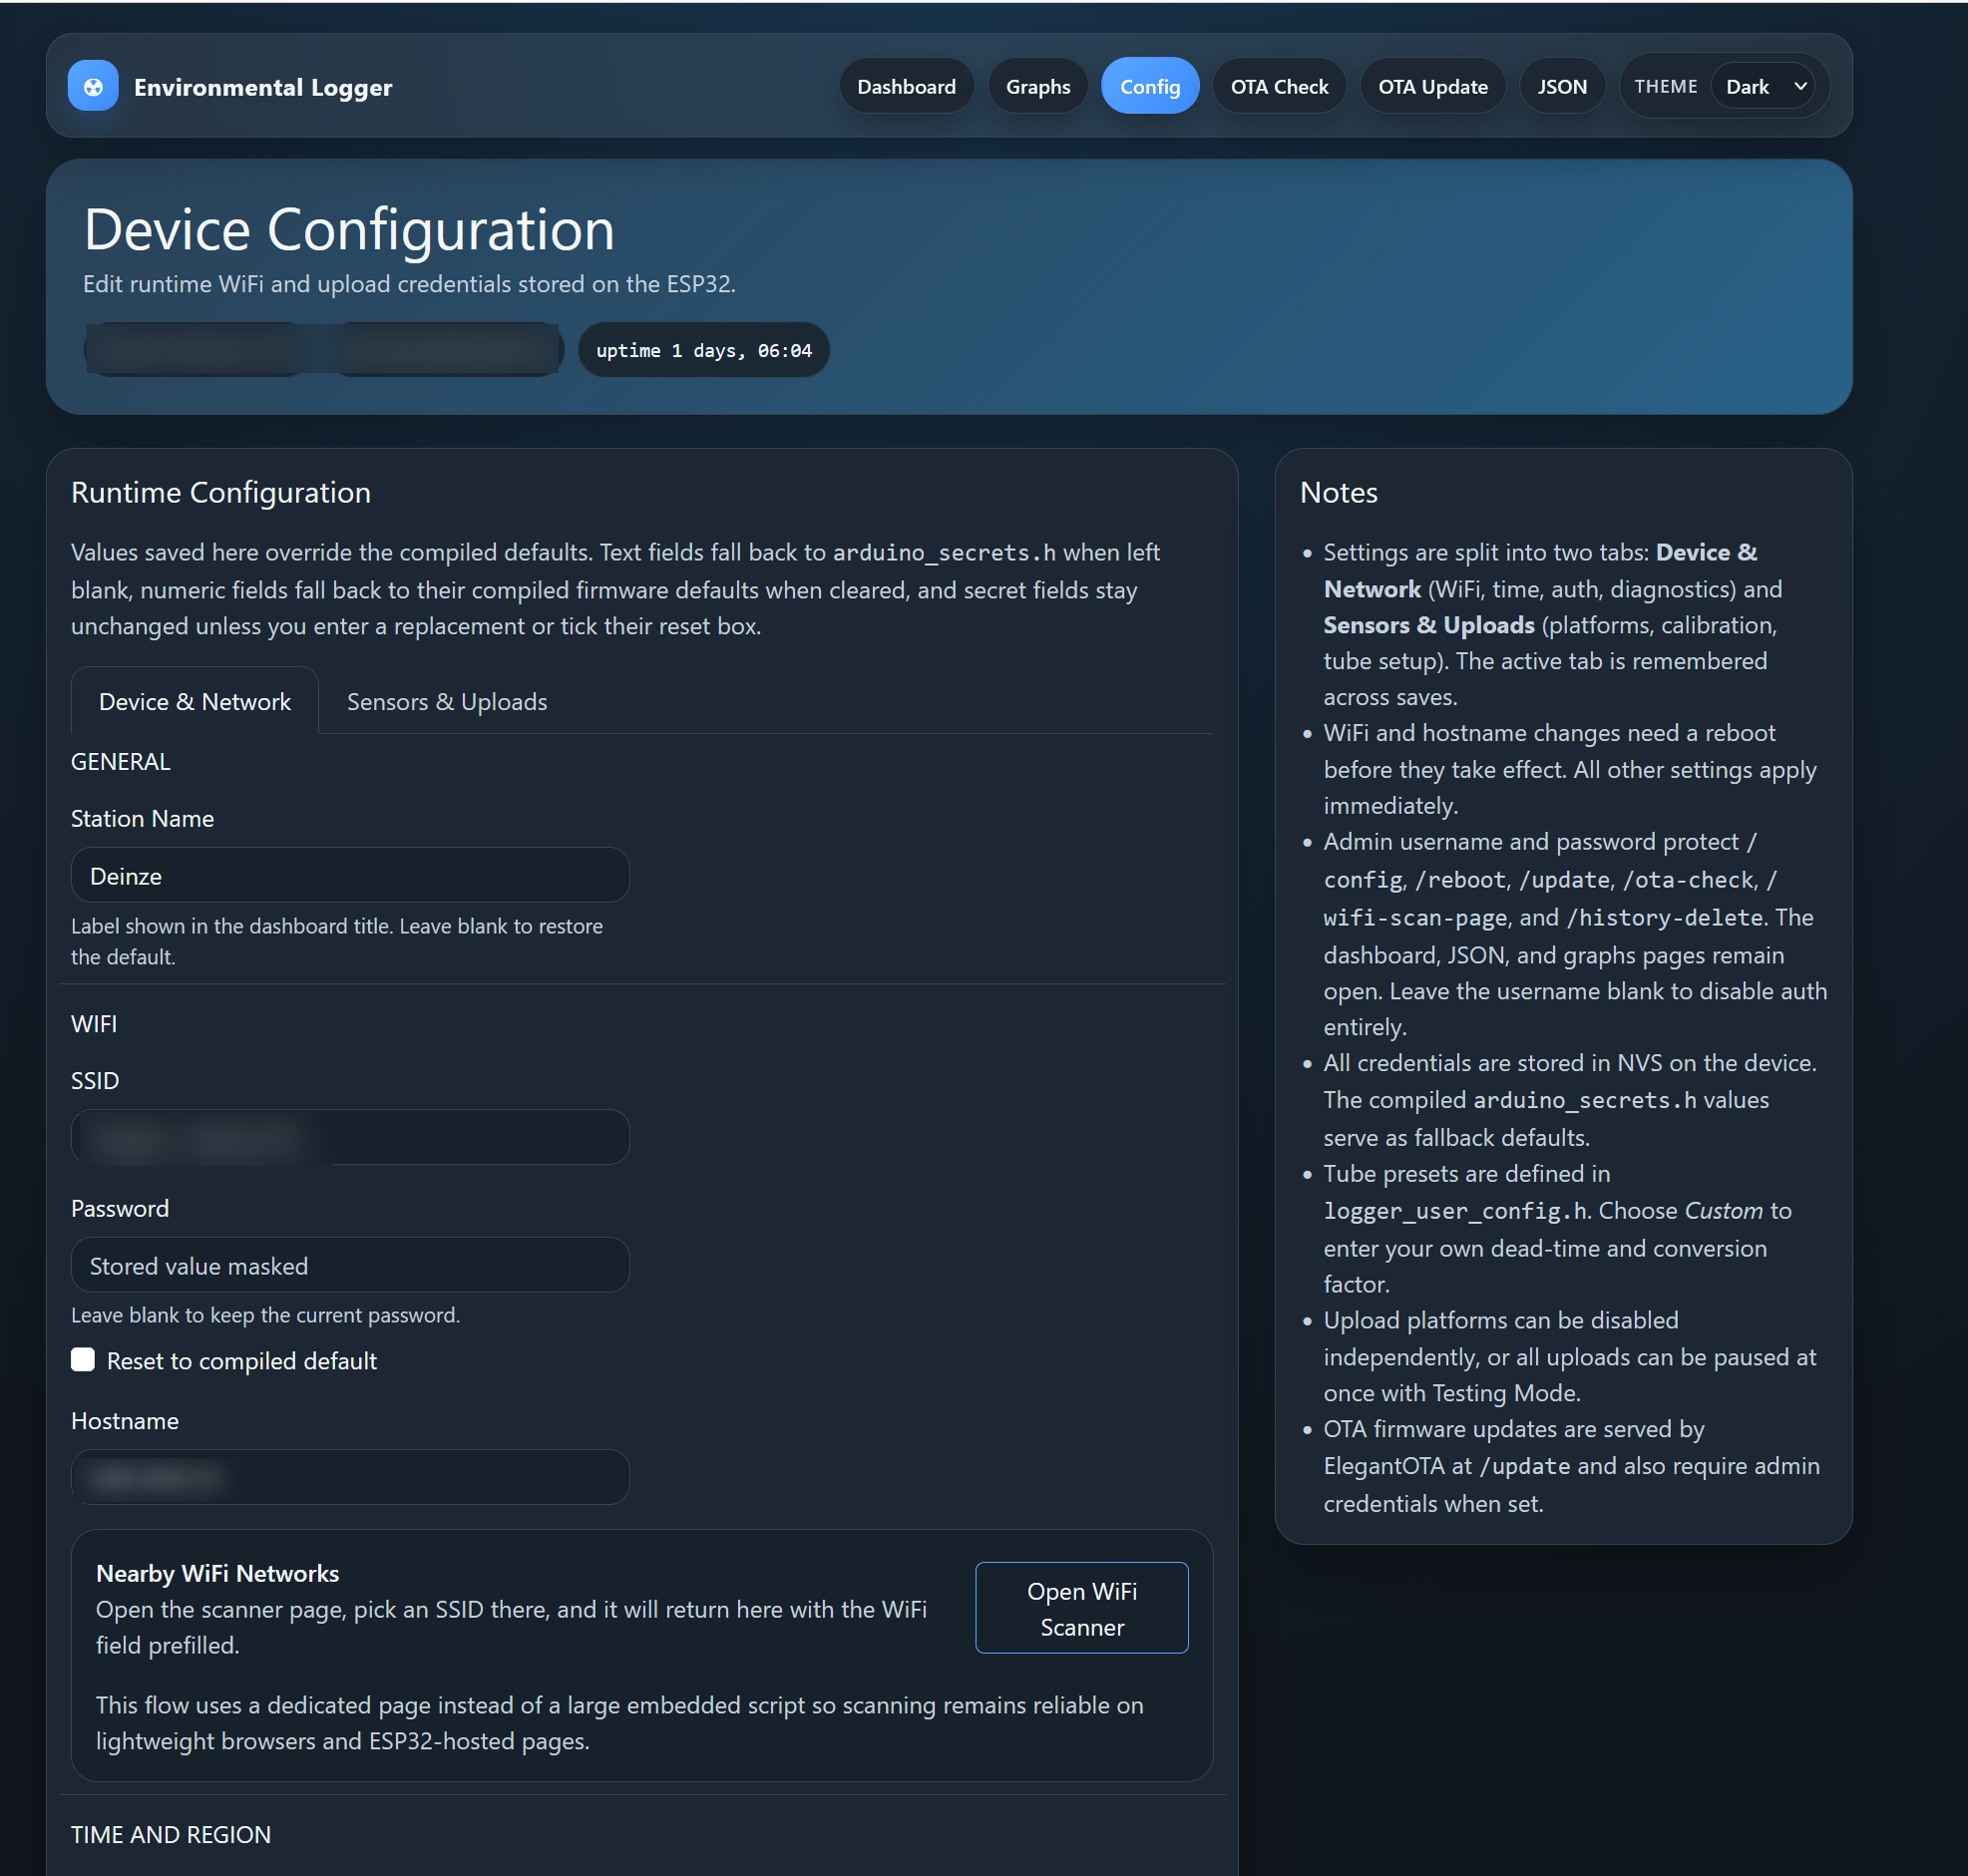
Main config overview
Tube selection option
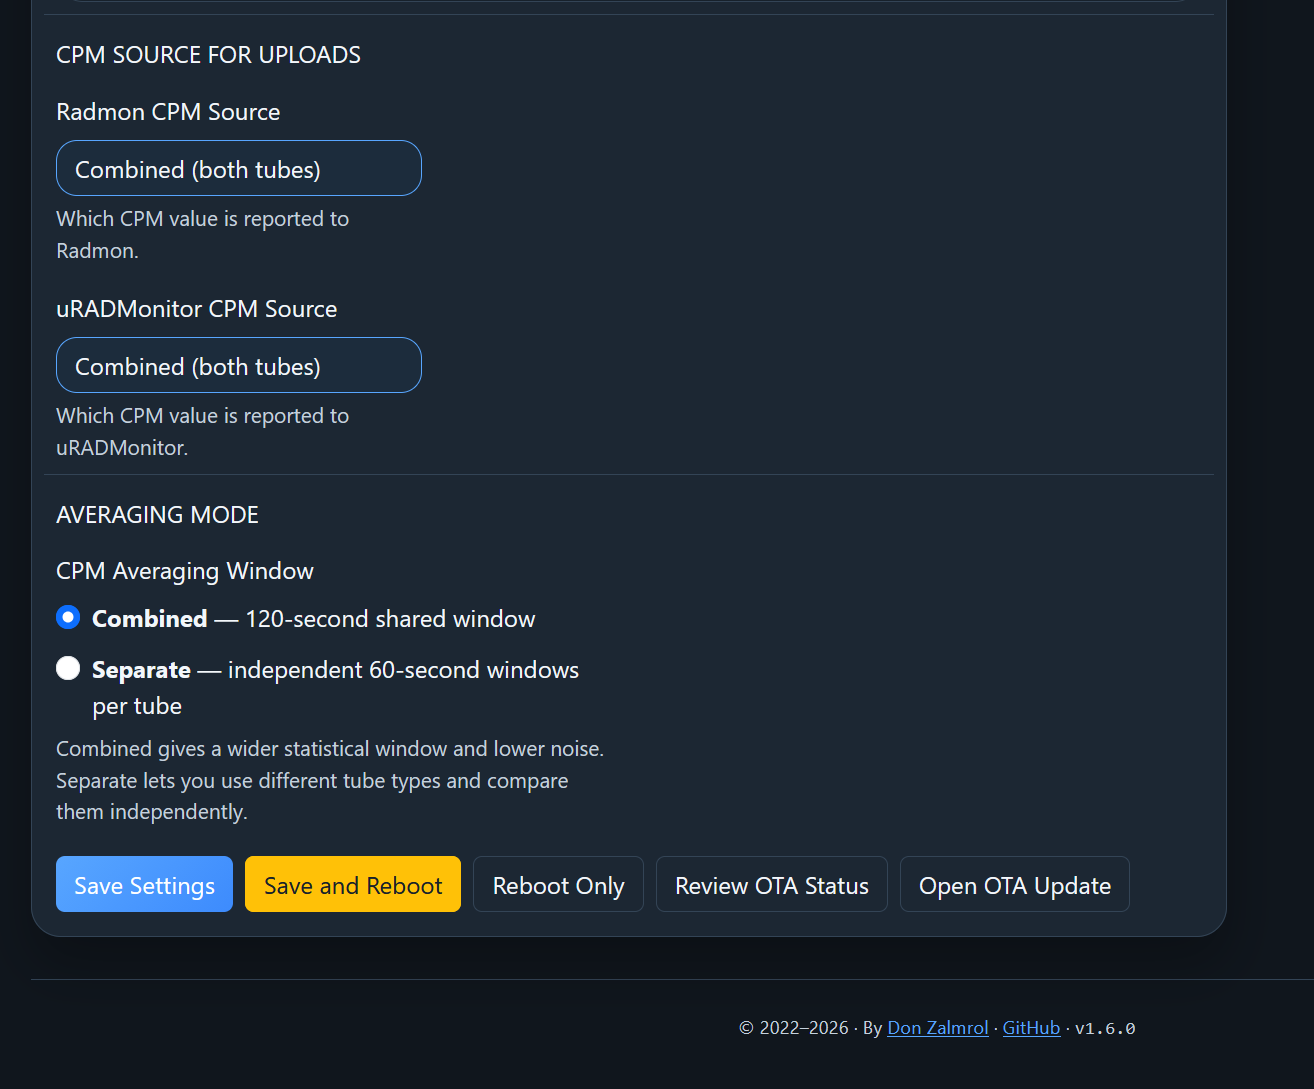
Option to pick combined moving average or per tube upload.
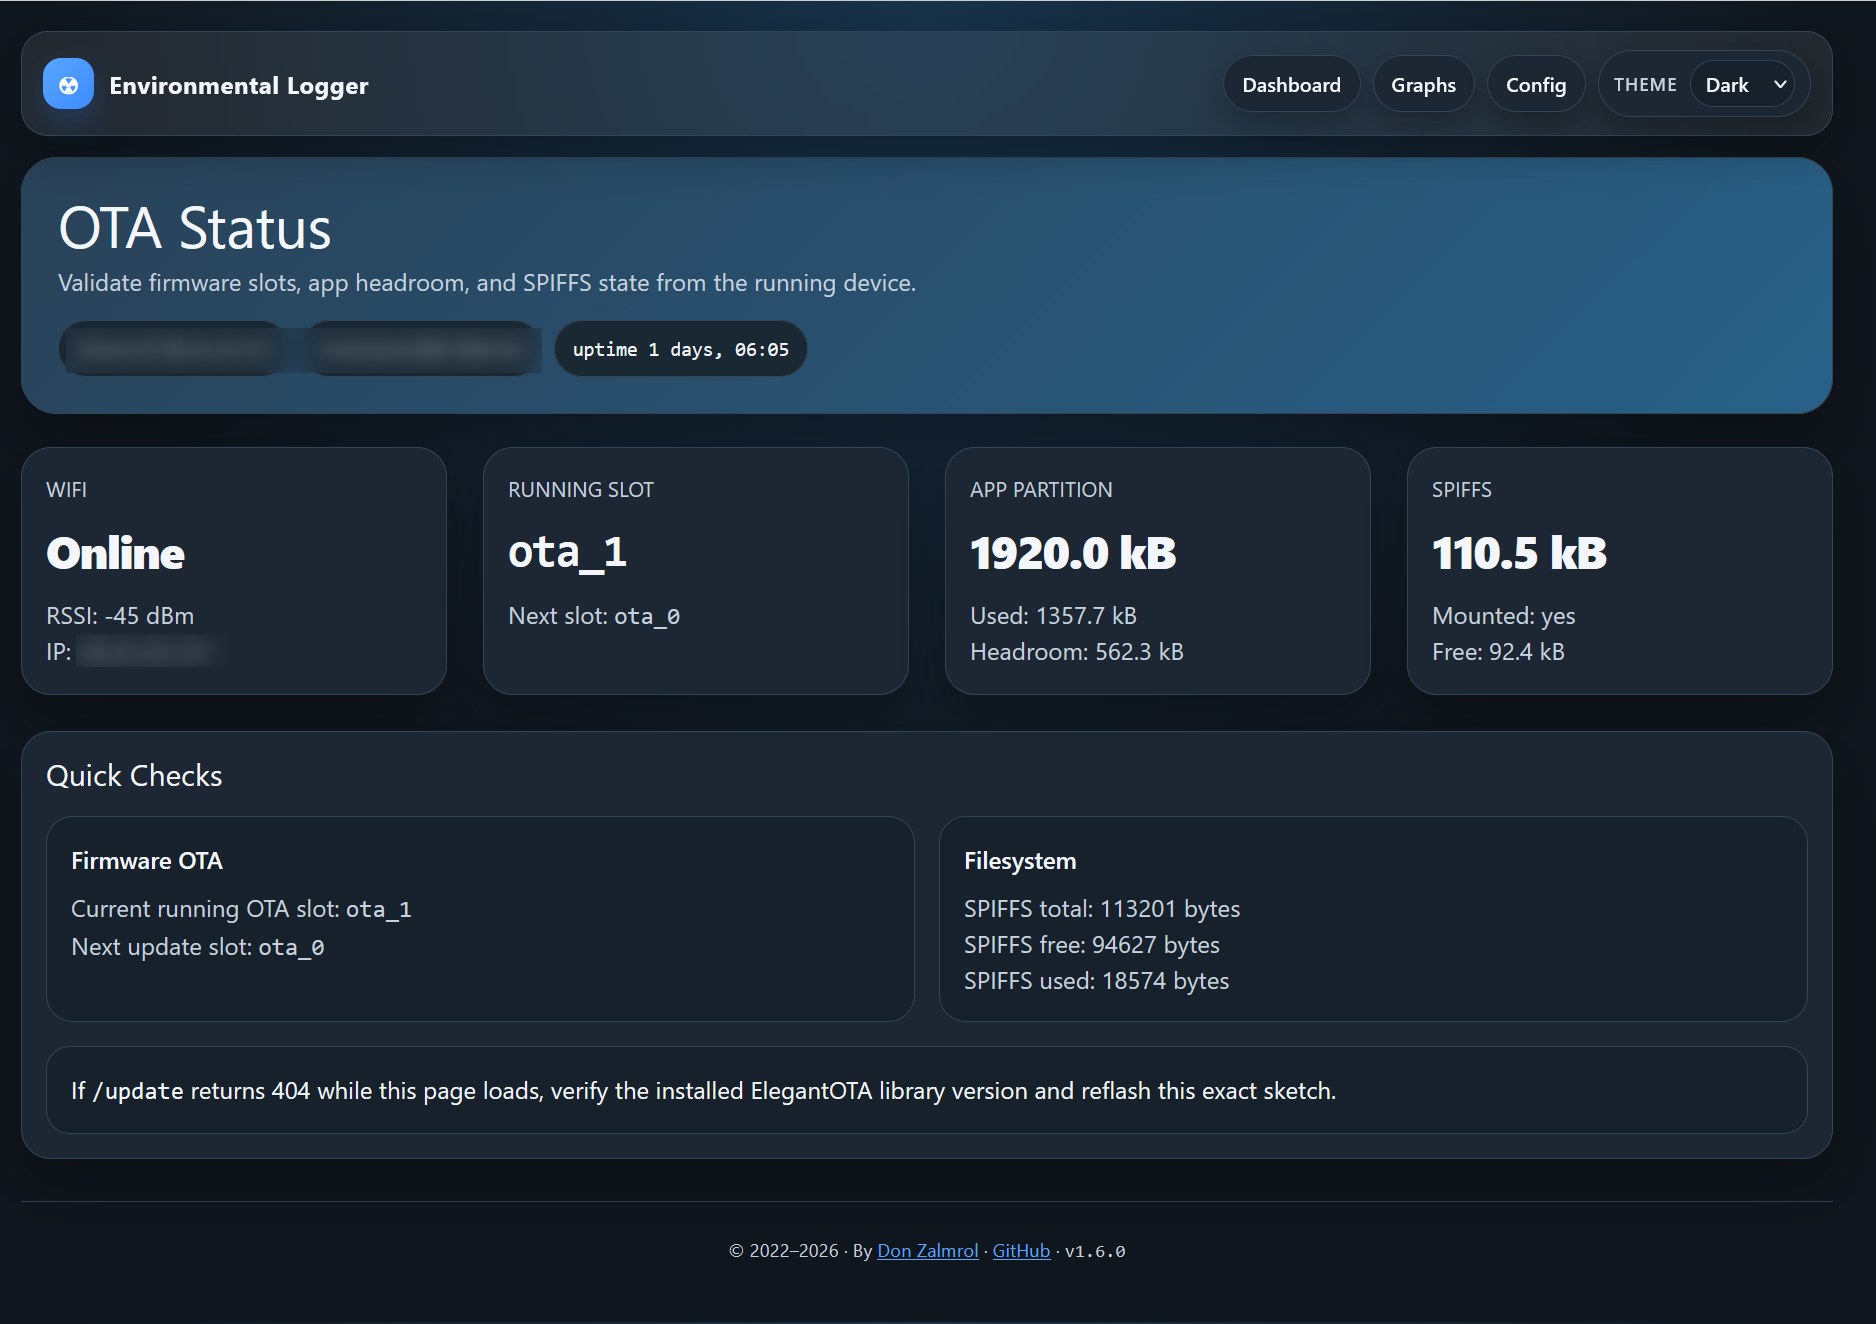
OTA health check and OTA update
1. First things first:
You will need to get your account and credentials to be able to upload, without this you can’t do squat.
- So first you’ll need to create an account -> https://www.uradmonitor.com/dashboard/
- Then go to the API tab and copy your
- User ID
- User Key (API hash)
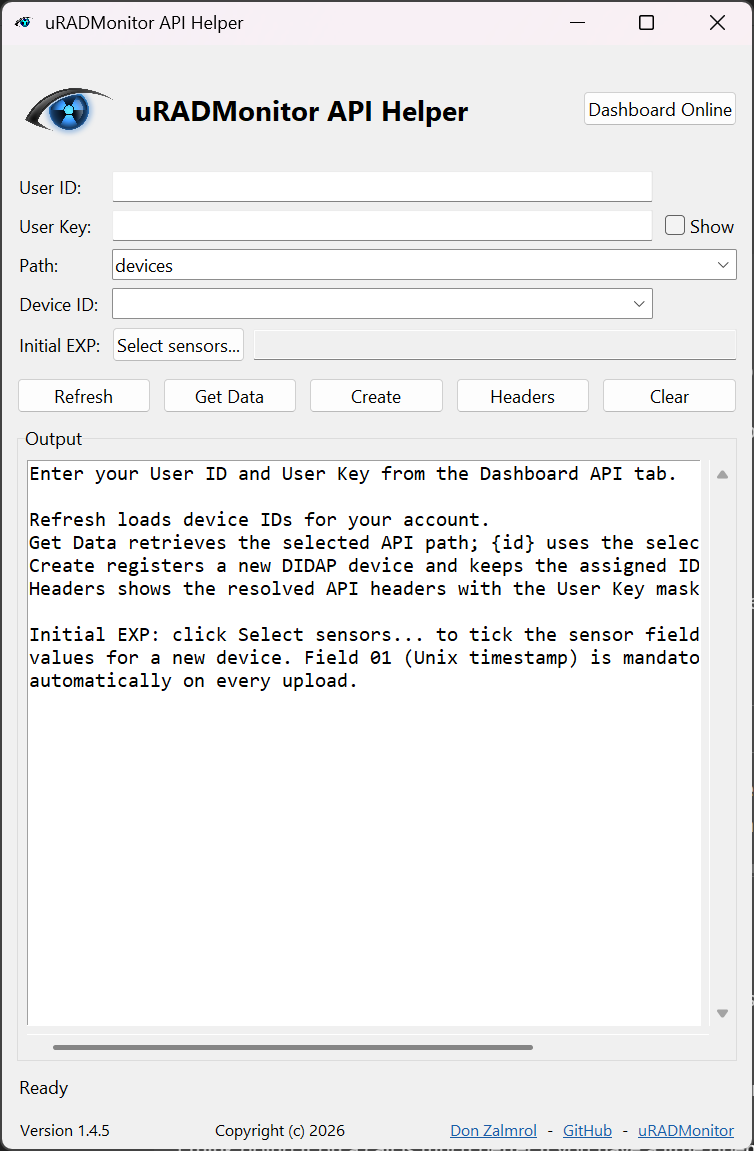
- Then back when I started I had help from a friend that showed me how to use Fiddler to get the API call set up and retrieve the X-* headers. This is still an option but tedious if you don’t know how to use Fiddler or curl. So I created a little Windows PowerShell script with a GUI that allows you some options to view, create, consult your account and device(s).
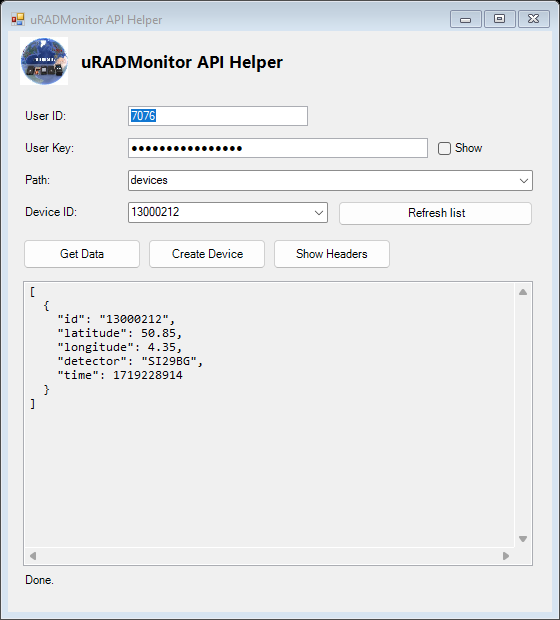
Link -> A small PowerShell helper for the uRADMonitor REST API
Once you’ve created your station. Contact uRADMonitoring support to add it your dashboard if it’s not showing, make sure to write down your station ID!
2. How the DIDAP (EXP) protocol is set up and used
Format example
The referenced ESP32 firmware builds a POST request like this:
https://data.uradmonitor.com/api/v1/upload/exp
/01/<unix-time>
/02/<temperature>
/03/<pressure>
/04/<humidity>
…
The values are then encoded in the URL path as alternating pairs:
The request uses these X-headers:
X-User-id: <uRADMonitor user ID>
X-User-hash: <uRADMonitor user key>
X-Device-id: <assigned device ID>
The request body is empty. The firmware performs the upload approximately every 61 seconds after collecting a snapshot of its sensor values.
Example of a full post:
POST https://data.uradmonitor.com/api/v1/upload/exp/01/1756800000/02/22.5/03/101325/04/48.2/05/350/06/125000/07/620/08/0.012/09/8/0B/145/0C/410/0D/48/0E/107/0F/124/10/0x3/12/5/13/12
X-User-id: 12345
X-User-hash: <user-key>
X-Device-id: 13001234
Some EXP fields used by the firmware
The following table reflects the field IDs implemented in my code -> Environmental_Stationary_Logger_V1.4.ino.
| Field ID | Measurement | Value expected | Unit / format | Status in firmware |
|---|---|---|---|---|
01 | Local time | Unix timestamp | Seconds since Unix epoch | Mandatory |
02 | Temperature | Decimal number | °C | Uploaded |
03 | Barometric pressure | Decimal number | Pa | Uploaded |
04 | Relative humidity | Decimal number | % RH | Uploaded |
05 | Luminosity | Integer/decimal | Firmware displays lux; source comment describes relative luminosity | Uploaded |
06 | VOC / gas resistance | Decimal number | Ohms | Uploaded |
07 | Carbon dioxide | Decimal number | ppm | Uploaded |
08 | Formaldehyde | Decimal number | ppm | Uploaded |
09 | PM2.5 | Integer/decimal | µg/m³ | Uploaded |
0A | Battery voltage | Decimal number | V | Commented out in firmware |
0B | Radiation | Integer/decimal | CPM | Uploaded |
0C | Geiger tube high voltage | Decimal number | V | Uploaded |
0D | HV drive index | Decimal number | % | Uploaded; estimated from tube voltage |
0E | Hardware version | Integer | Firmware-defined version number | Uploaded as 107 |
0F | Software version | Integer | Firmware-defined version number | Uploaded as 124 |
10 | Tube ID | Identifier | Firmware-defined value, e.g. 0x3 | Uploaded |
11 | Noise | Decimal number | dB | Commented out in firmware |
12 | PM1.0 | Integer/decimal | µg/m³ | Uploaded |
13 | PM10 | Integer/decimal | µg/m³ | Uploaded |
14 | Ozone | Decimal number | ppb | Commented out in firmware |
For ESP32 the below ino sketch example could be used as a starting point
#include <WiFi.h>
#include <HTTPClient.h>
#include <WiFiClientSecure.h>

const char *WIFI_SSID = "YOUR_WIFI_SSID";
const char *WIFI_PASSWORD = "YOUR_WIFI_PASSWORD";
const char *USER_ID = "YOUR_USER_ID";
const char *USER_KEY = "YOUR_USER_KEY";
const char *DEVICE_ID = "YOUR_DEVICE_ID";

unsigned long wifiConnectedAt = 0;
bool uploadSent = false;

void setup()
{
  Serial.begin(115200);
  WiFi.begin(WIFI_SSID, WIFI_PASSWORD);

  while (WiFi.status() != WL_CONNECTED)
  {
    delay(500);
    Serial.print('.');
  }

  wifiConnectedAt = millis();
  Serial.println("\nWi-Fi connected; upload will run after 61 seconds.");
}

void loop()
{
  if (!uploadSent && (millis() - wifiConnectedAt >= 61000UL))
  {
    WiFiClientSecure tlsClient;
    tlsClient.setInsecure(); // Test only; use the server CA certificate in production.

    const char *uploadUrl =
      "https://data.uradmonitor.com/api/v1/upload/exp/"
      "01/1788355200/02/22.5/03/101325/04/48.2/05/350/06/125000/"
      "07/620/08/0.012/09/8/0B/145/0C/410/0D/48/0E/107/0F/124/"
      "10/0x3/12/5/13/12";

    HTTPClient http;
    http.begin(tlsClient, uploadUrl);
    http.addHeader("X-User-id", USER_ID);
    http.addHeader("X-User-hash", USER_KEY);
    http.addHeader("X-Device-id", DEVICE_ID);

    int statusCode = http.POST("");
    Serial.printf("uRADMonitor upload status: %d\n", statusCode);
    Serial.println(http.getString());
    http.end();
    uploadSent = true;
  }
}
Sources:
- DIDAP (EXProtocol) https://www.uradmonitor.com/open-data-upload-tutorial/
- A small PowerShell helper for the uRADMonitor REST API
- My DIY environmental logger with full ESP32 code
- A neat little desktop logger app was made with Python that allows me to monitor it from my computer
Happy logging!

Amazing post. Thank you for the super detailed explanations and clear examples!
Thanks!