
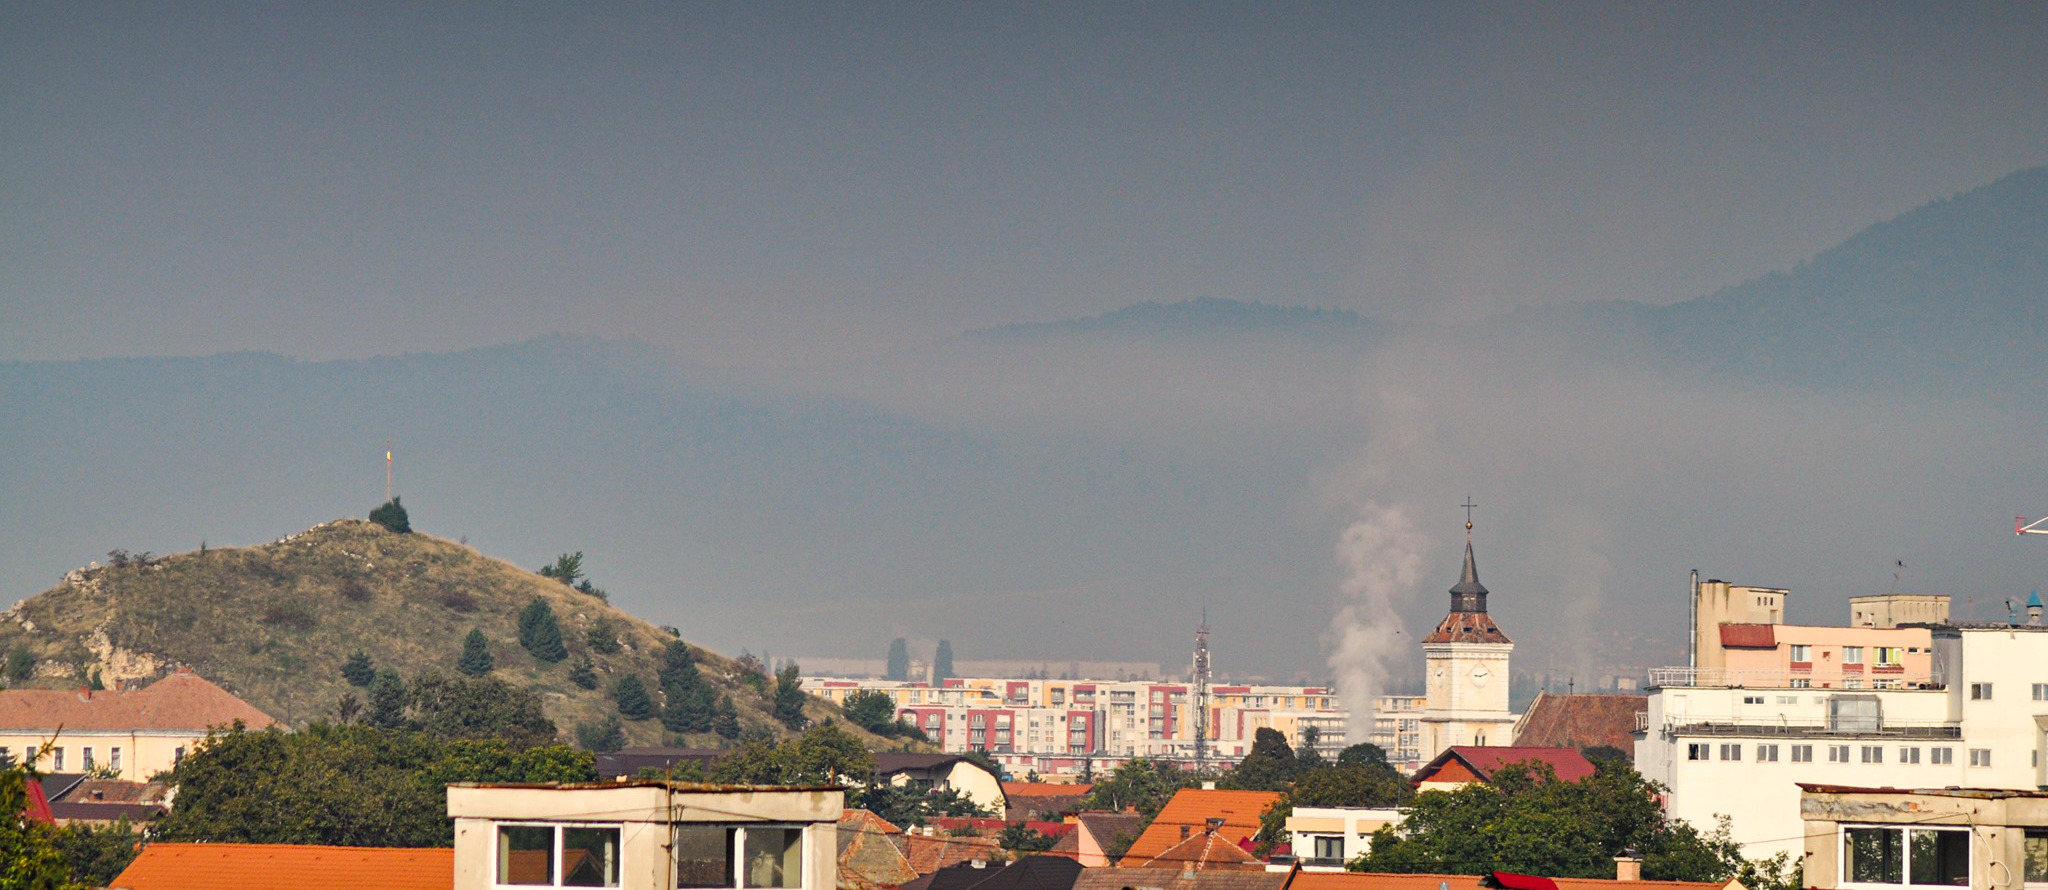
PM2.5 is the name for particles in the air with a diameter of 2.5 micrometres or less. That is about thirty times thinner than a human hair. Particles this small pass the nose and throat, reach deep into the lungs, and the finest ones enter the bloodstream. The European Environment Agency counts fine particulate matter as the air pollutant with the largest impact on health in Europe.
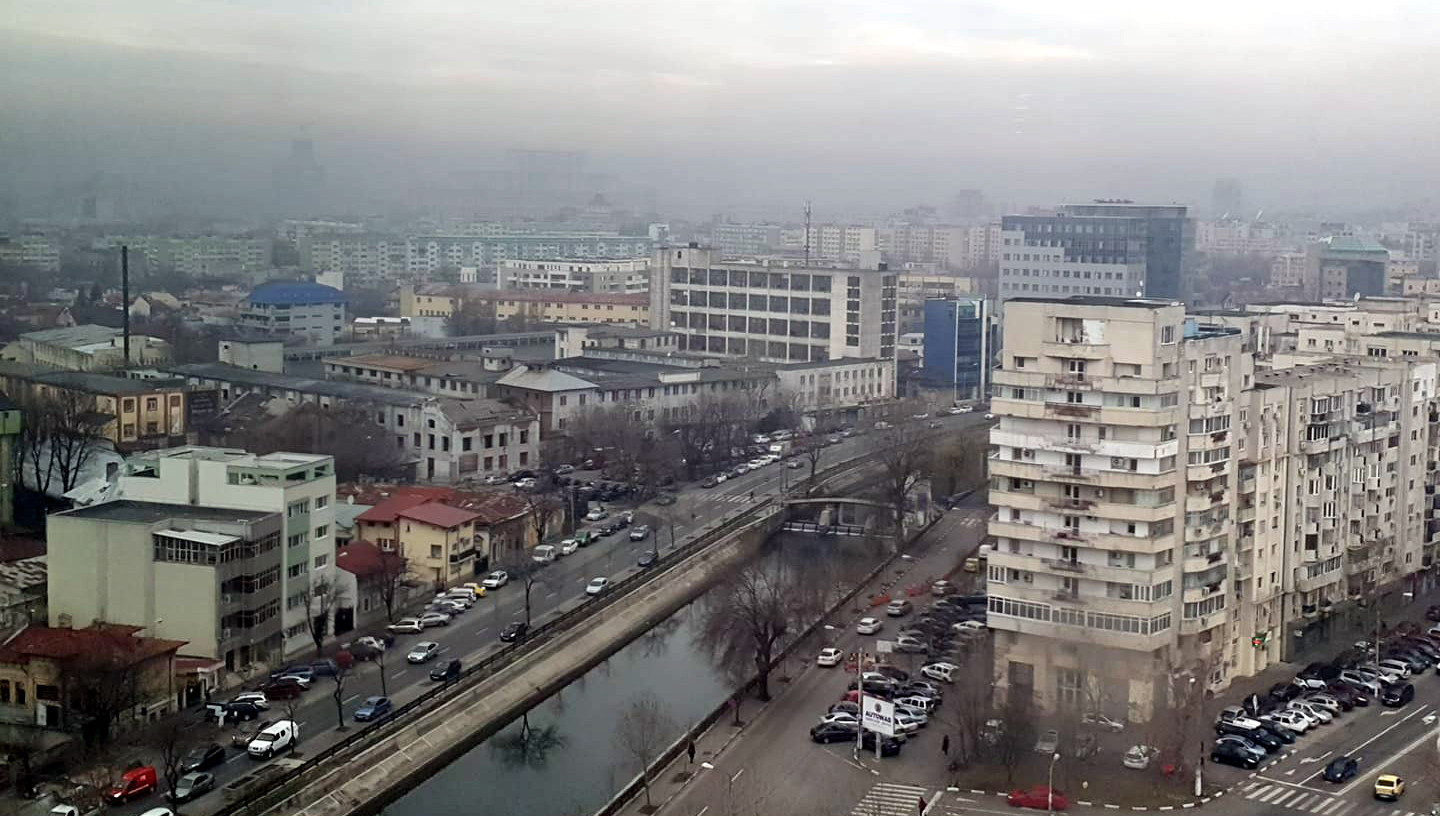
Where PM2.5 comes from
- Heating: burning wood and coal in homes is the main source in many European towns in winter.
- Traffic: exhaust, and also brake and tyre wear.
- Industry and energy production.
- Agriculture: ammonia from fertilisers forms secondary particles in the air.
- Natural sources: desert dust, wildfire smoke, sea salt.
PM2.5 can travel hundreds of kilometres. Part of what you breathe was produced far away.
Limits and guidelines
| Reference | Annual average | 24-hour average |
|---|---|---|
| WHO air quality guidelines (2021) | 5 µg/m³ | 15 µg/m³ |
| EU limit until 2030 | 25 µg/m³ | none |
| EU limit from 2030, Directive (EU) 2024/2881 | 10 µg/m³ | 25 µg/m³, at most 18 days a year |
The WHO guideline is a health target, not a legal limit. Most European cities are above it today.
The European Air Quality Index
The European Environment Agency translates concentrations into six bands. In 2024 it revised the bands to follow the WHO guidelines. For hourly PM2.5:
| Band | PM2.5 (µg/m³) |
|---|---|
| 1 Good | 0 to 5 |
| 2 Fair | 5 to 15 |
| 3 Moderate | 15 to 50 |
| 4 Poor | 50 to 90 |
| 5 Very poor | 90 to 140 |
| 6 Extremely poor | above 140 |
uRADMonitor uses the same six bands on its city pages and in the AQI value of every station.
Why one number is not enough
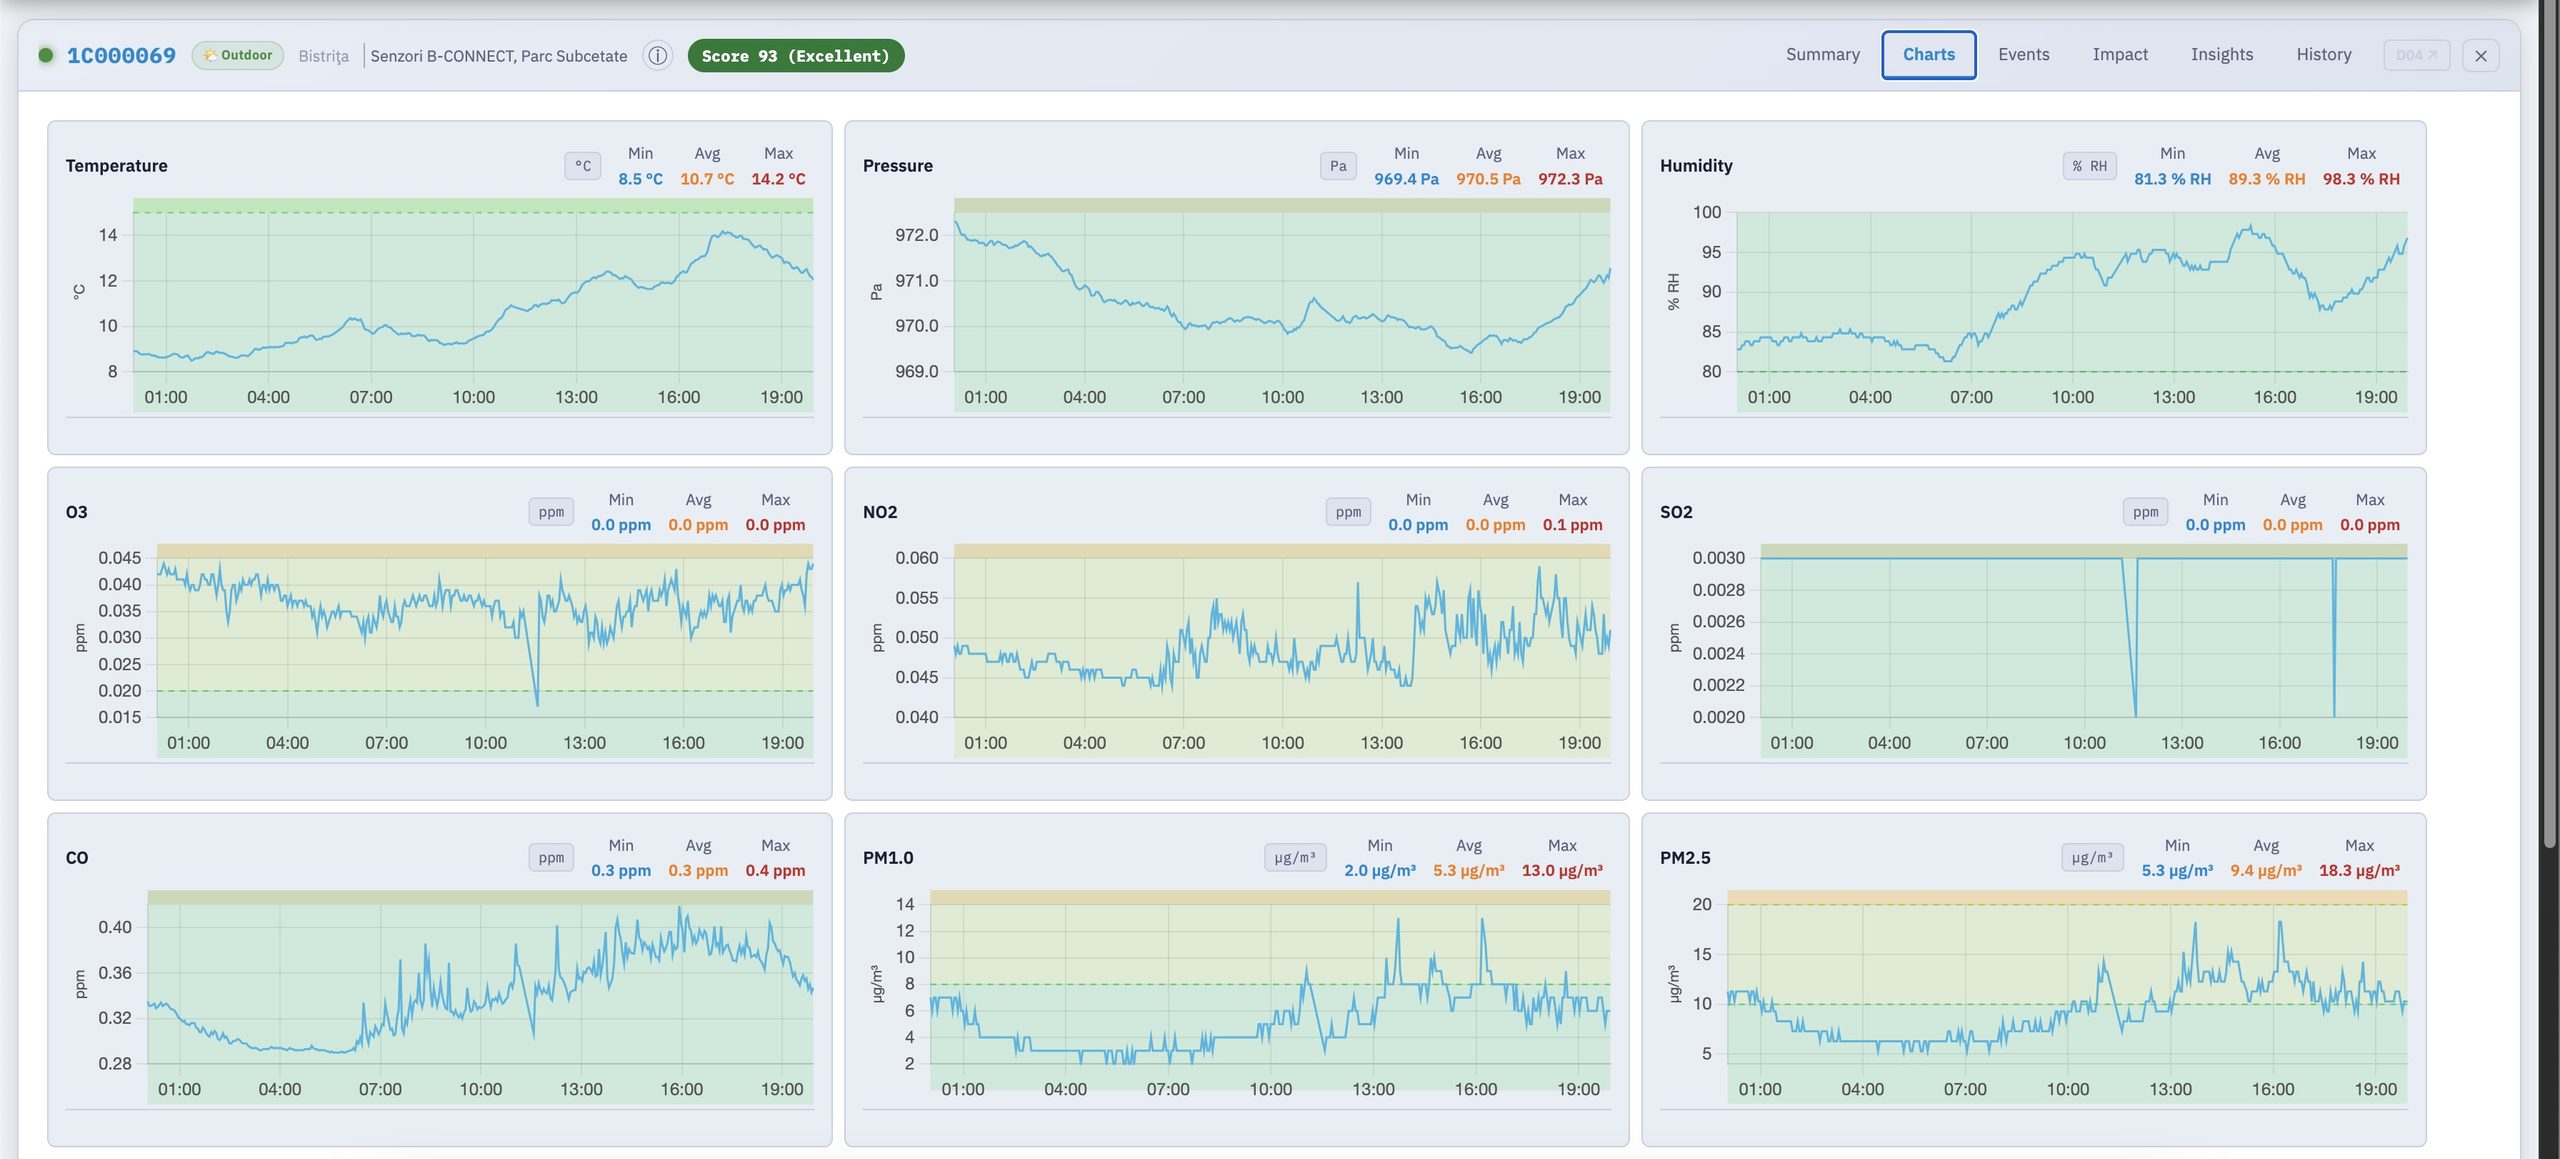
PM2.5 changes quickly. In towns with wood heating, it often rises sharply in the evening and at night, then falls during the day. Temperature inversions trap particles close to the ground on cold, still days. A daily average can hide short peaks of several times the average.
That is why continuous measurement matters, and why measurements close to where people live often differ from the nearest official station.
How low-cost sensors measure PM2.5
Most compact monitors, including uRADMonitor stations, use laser scattering. A laser lights the air drawn through a small chamber, and the sensor counts and sizes the particles from the scattered light. This method responds in seconds and costs little, which makes dense networks possible.
It has limits. Very high humidity makes particles swell and can increase the readings, and the result depends on the type of particles. Good practice is to compare sensors with reference stations and to look at trends and differences between places, not only at single absolute values.
Check PM2.5 in your city
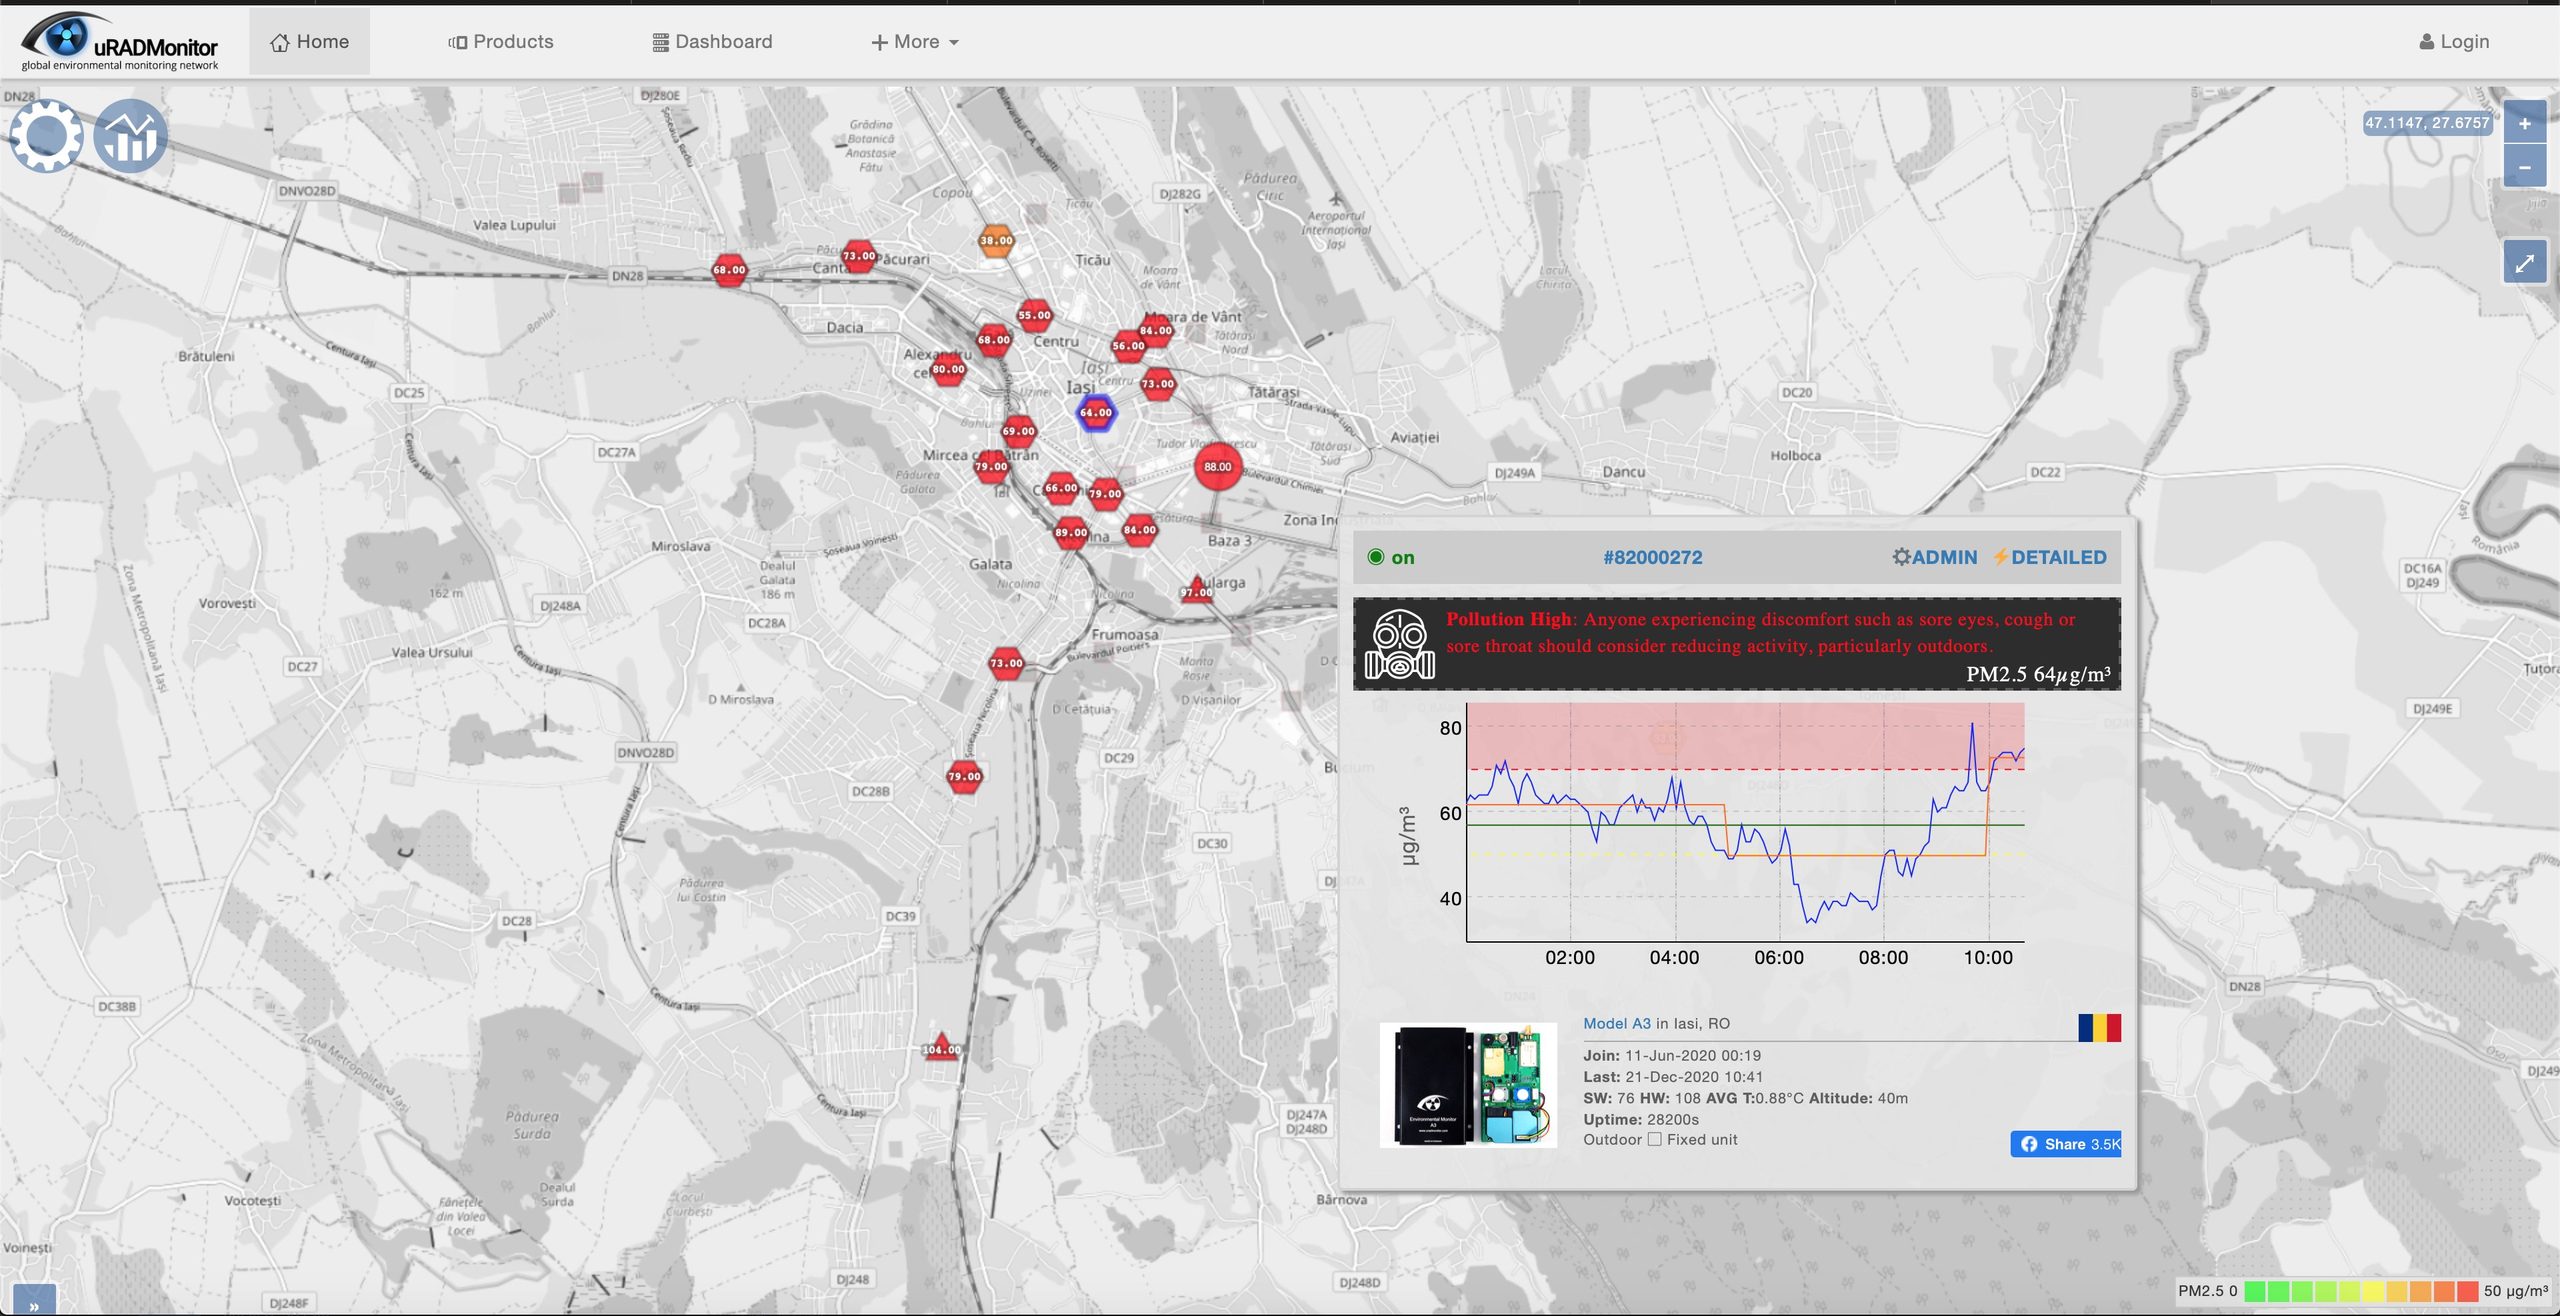
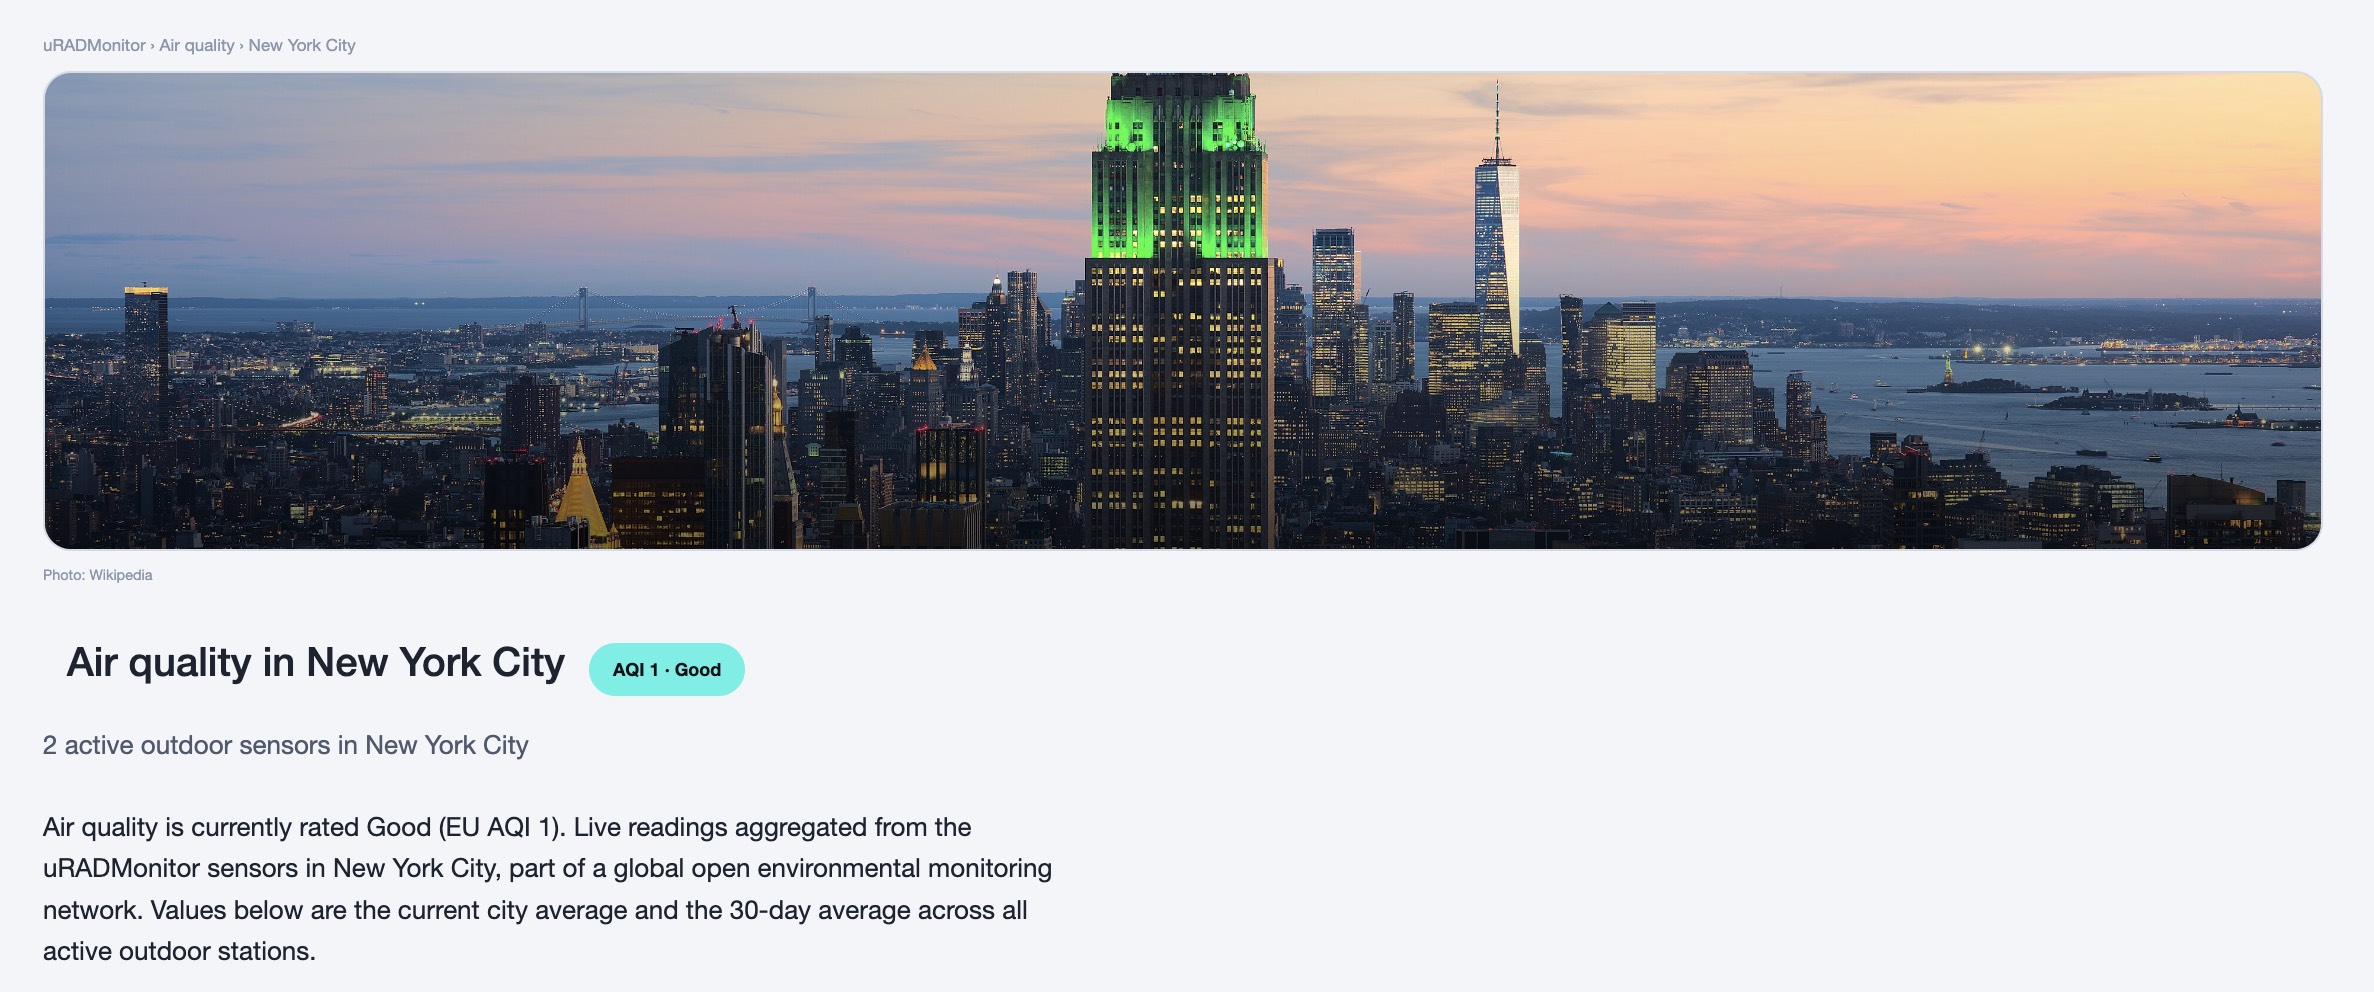
The uRADMonitor network publishes live PM2.5 for every city with active outdoor sensors, with the current value, the 30-day average and the EAQI band:
- Air quality by city
- Live map, PM2.5 layer
Each month we also publish a ranking of the cities by PM2.5.
Measure the air where you live
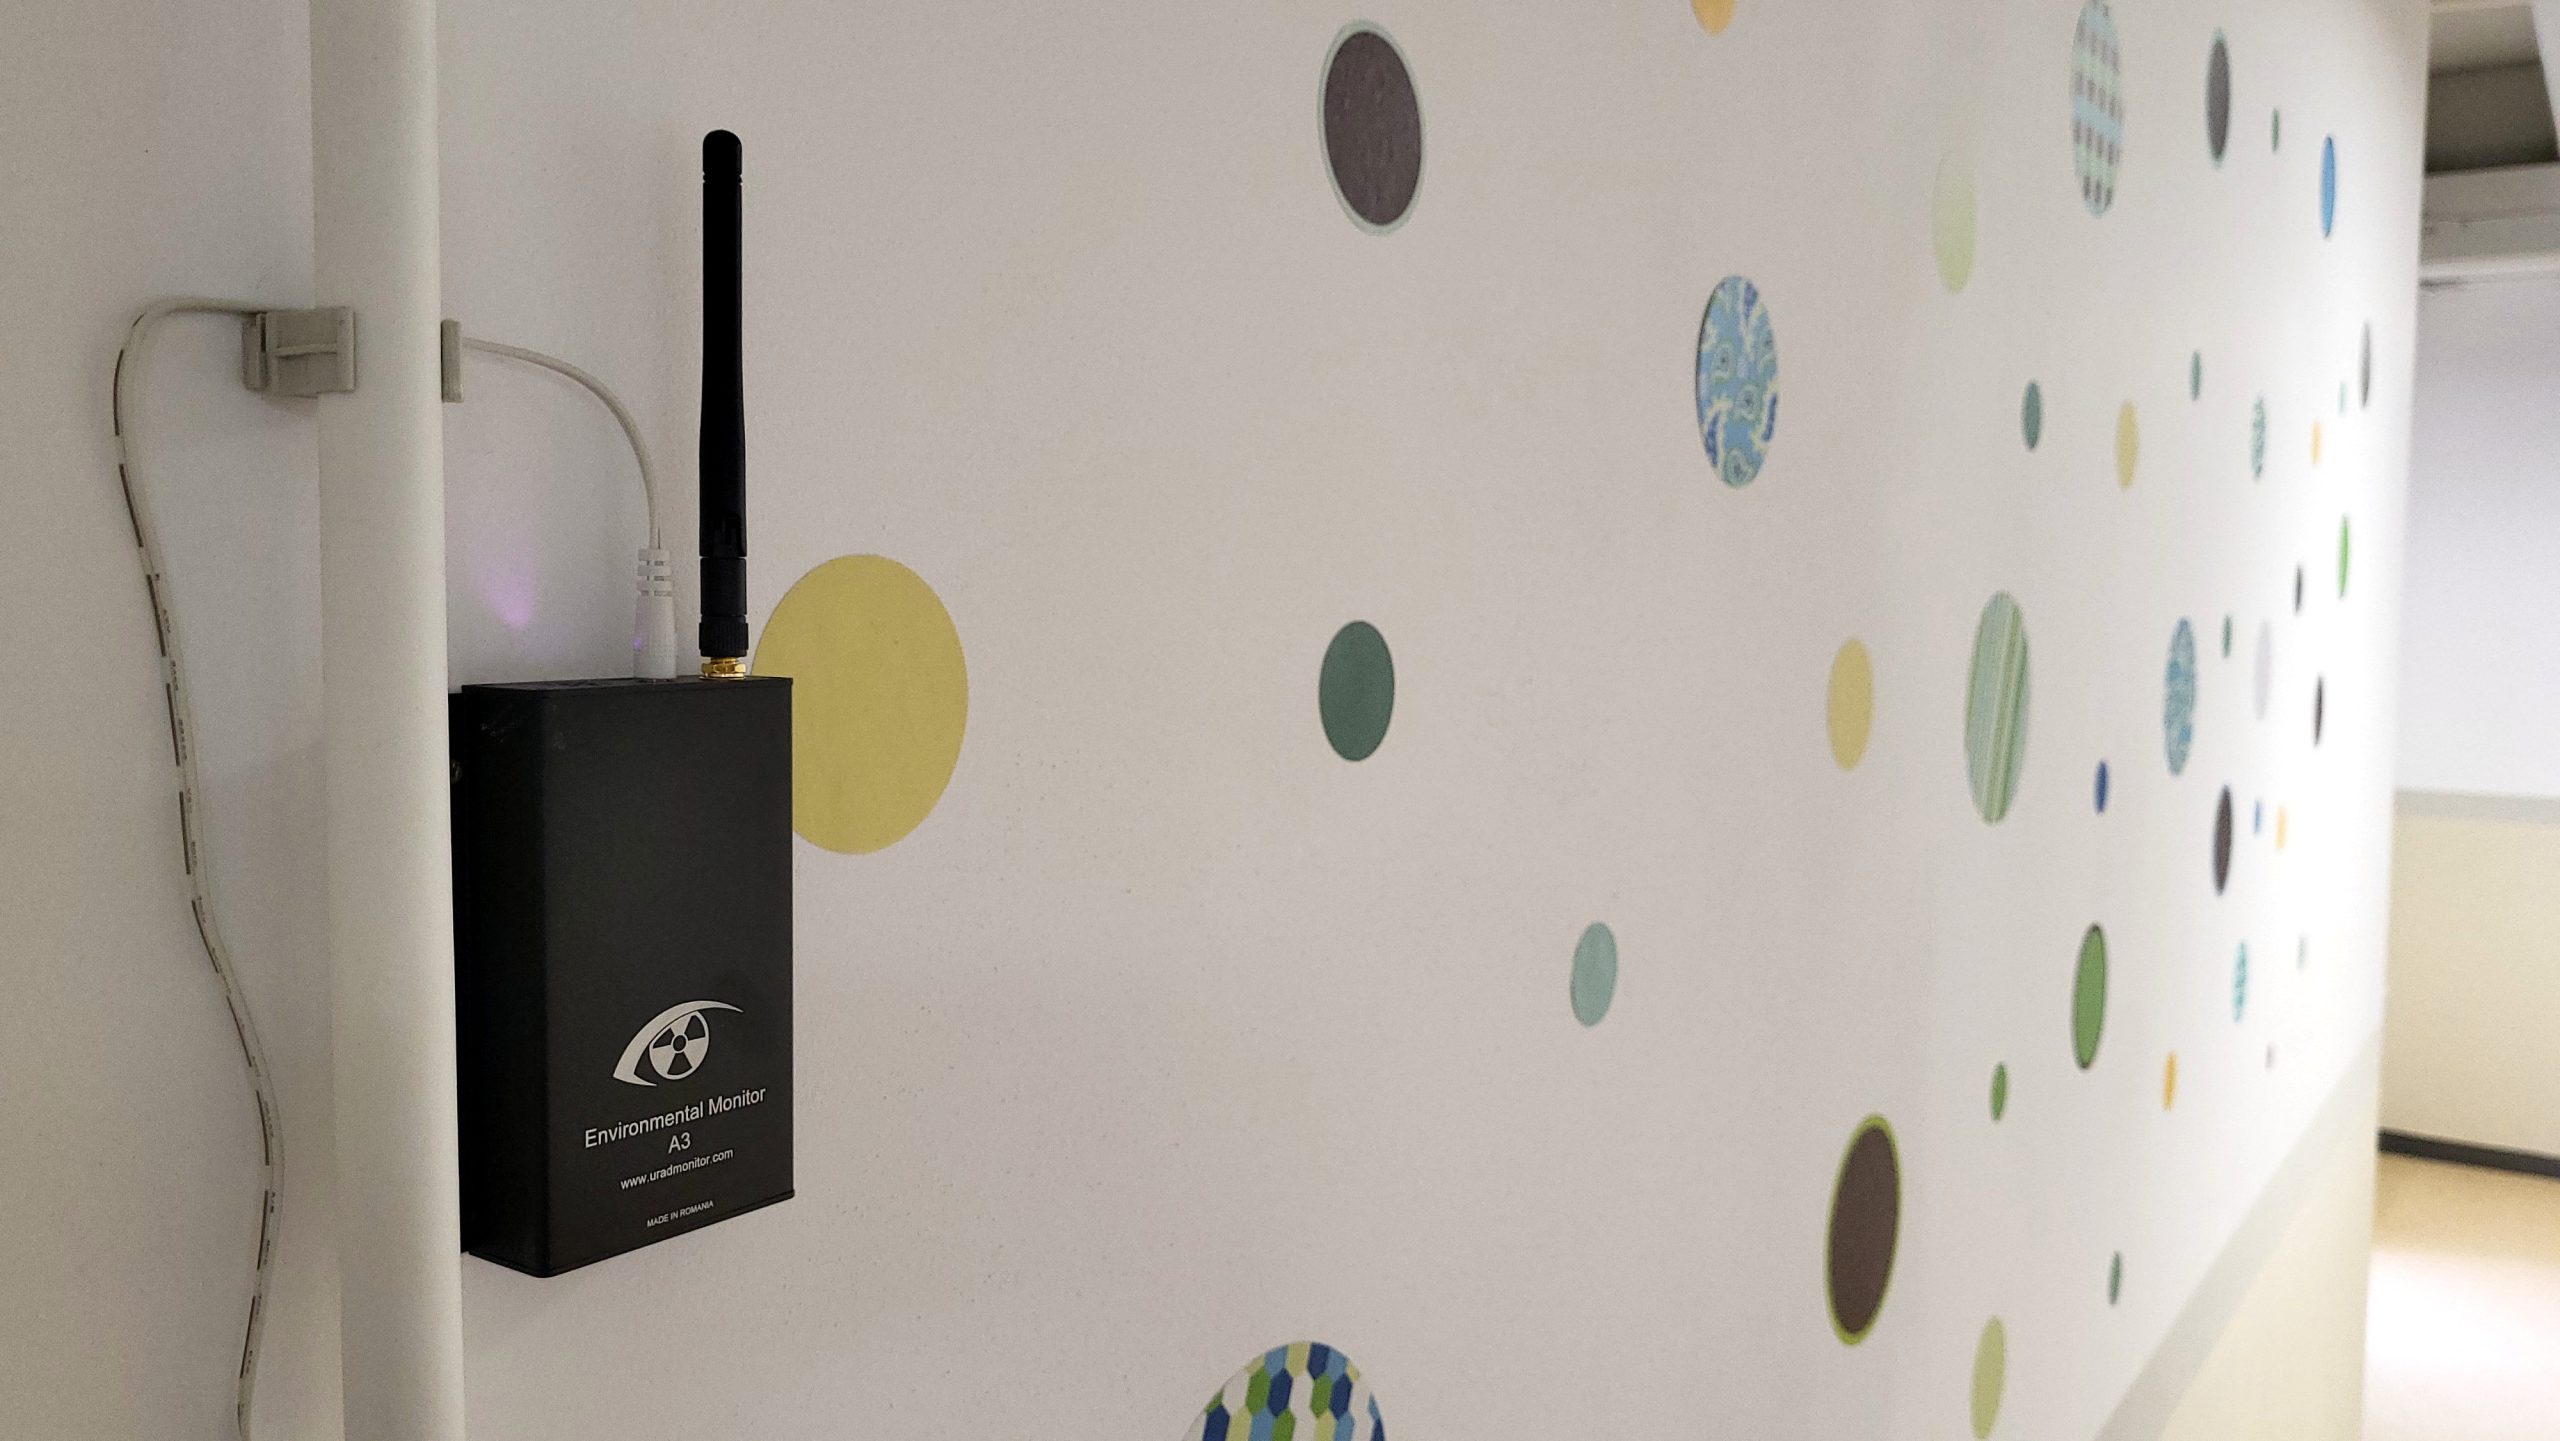
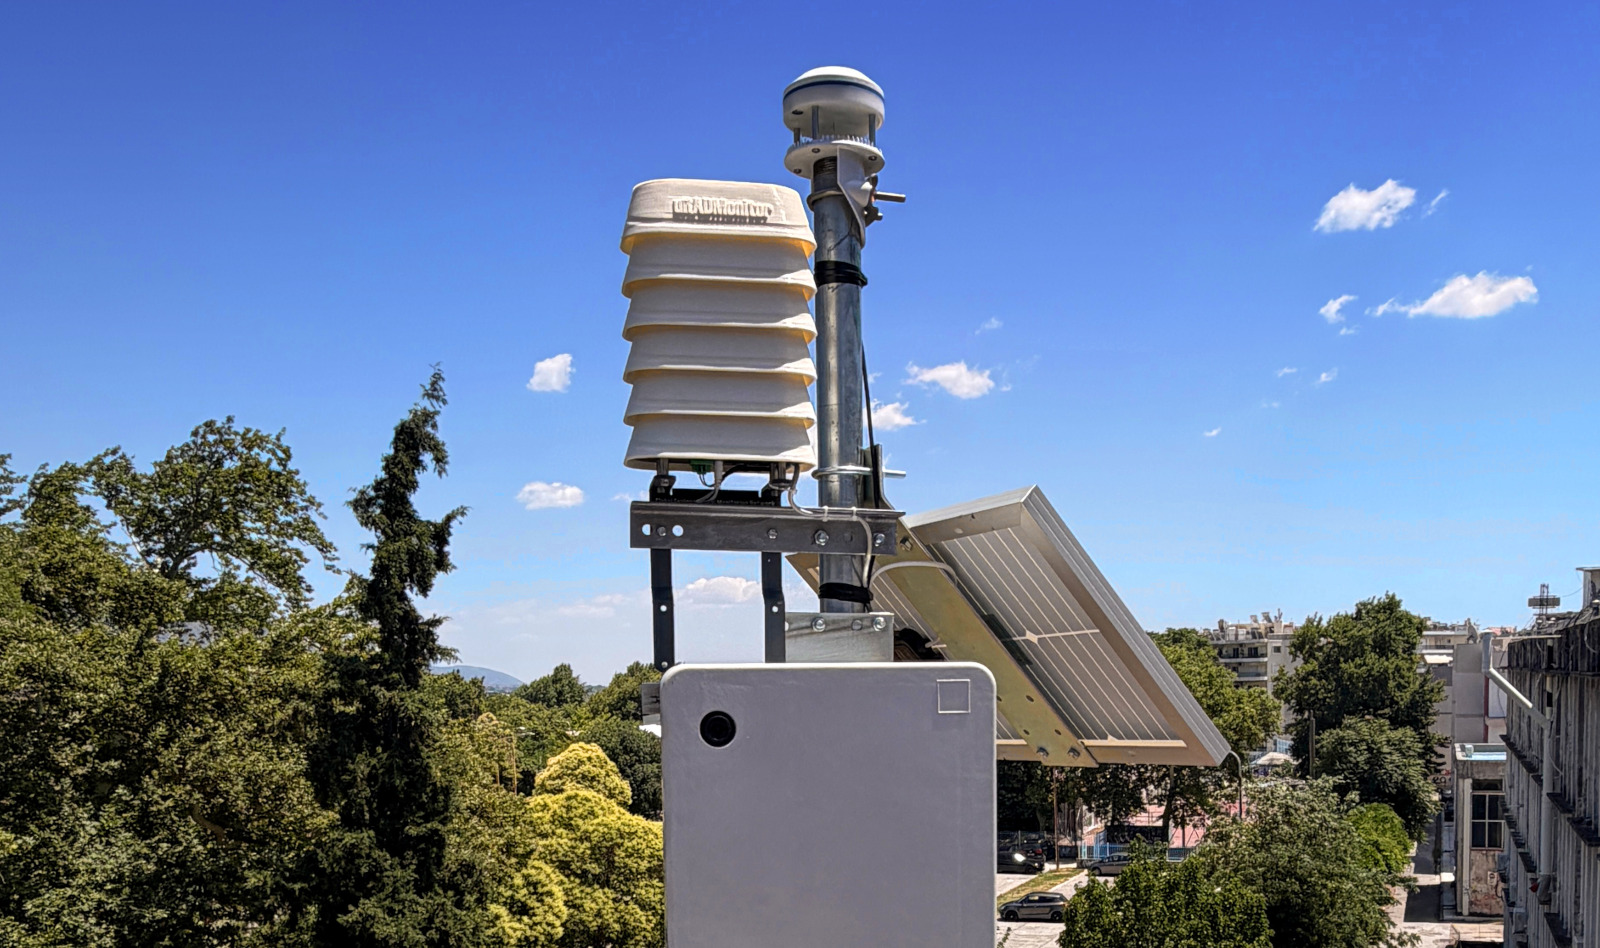
SMOGGIE-PM is a small outdoor PM1, PM2.5 and PM10 sensor in a Stevenson shield, connected over WiFi. For a complete outdoor station with gases and noise, see MODEL A3 with the outdoor shield. Every new sensor adds a point to the public map of your city.
Sensor readings are indicative and not a substitute for official regulatory monitoring.
Liked this? Get monthly air quality findings.
One email a month from the uRADMonitor network. Unsubscribe anytime.
codemore code
~~~~