The purpose of the Dashboard is to offer an interface to the uRADMonitor system, the global data and the uRADMonitor detectors.
Dashboard presentation
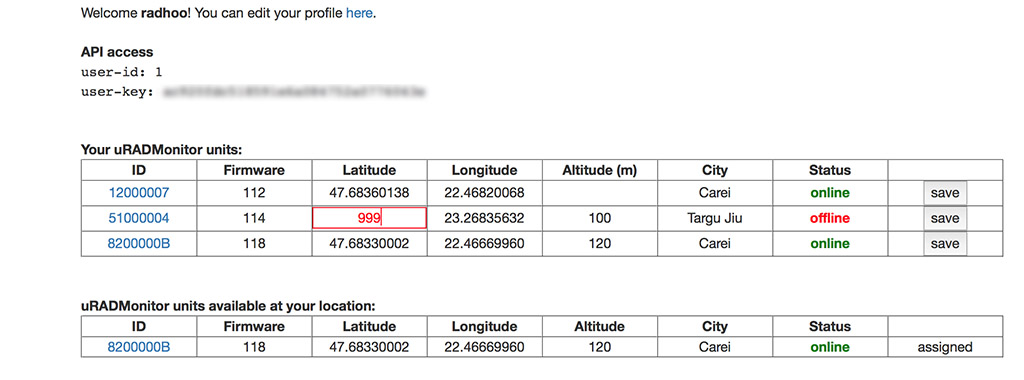
Using the Dashboard, you can see your connected units, add them to your account and manage them further. This includes changing the coordinates of your uRADMonitor unit on the map, either for better privacy or for better accuracy.
The dashboard is also the starting place for instructions on how to use the public API to extract json formatted data. For this, each user is given a user ID, and a secret key. Keep this details private, as they identify your data access across the uRADMonitor network. The API is both for getting global environmental data, but also for injecting data in case you’ve built your own open source detector.
The DATA tab
The DATA tab can be used to download datasets in CSV format. This way you can import them to your processing software. Here’s an example where a PM10 dataset is imported in Excel to create a chart to visualize the data:
Finally, the dashboard lets you set notifications for when certain measured parameters are reached. It can be parameters related to your own uRADMonitor unit, or any other unit in the network. Set the thresholds and get an instant notification on your phone or via email.
Some of these features were requested by the community, on the uRADMonitor Forum.
Hi
I can’t use Dashboard : I get “There are no units attached to your account” message ?
Best regards
Thanks Olivier. Indeed there was a bug in the system, preventing units with firmware <= v110 to appear in the dashboard. It is now fixed, please try again.
Hi, Radhoo
My uradmonitor model A is out since a year. Today I found time to change the ethernet board (found the same to by at aliexpress) : it is still not working.
So, gime a price to replace the all device.
ciao
Hi Louis,
I see your unit last transmitted data on May 12, 2017. It appears your reparation was successful?
See it here: http://www.uradmonitor.com/?open=11000077
Let me know
Radu
I think I have the same problem as Astro65. I can’t figure out how to see my unit in the Dashboard.
That’s strange, I’ve just sent you an email, please check it.
Works now. Altitude is above sea level? Not ground level?
It is above sea level
Same problem as above, no unit attached to my dashboard.
Try clearing the browser’s cache?
The browsser cash is cleared on each closign of the browser. i checked: current size 0.
It works now. The problem was that i accessed from another network.
The device must be at the same WAN-ip address than the computer you open the dashboard.
Problem solved by opening a VPN connecton to the network where the device is before opening the dashboard.
Thanks for the suggestion. Hints added.
“….. the dashboard lets you set notifications for when certain measured parameters are reached….”
Is this a future facility ? I cannot find how to access the feature described in the current dashboard.
Indeed. I am working to add this feature as well.
Is there any way to add a device on a different IP as I don’t use NAT so the my desktop/laptop/etc. is always going to be on a different IP to the monitor?
Yes, by contacting me / manually, just the very first time.
Radu, it is perfect! Thank you very much for what you are doing!!!
B.Rdgs,
Marco
Hmm. I think selecting more than one day in time interval combined with sensor “All” doesn’t work. If I select one sensor it works. Or if I select one day with sensor “All”.
Could somebody confirm?
Hi Witold, your findings are correct, “All” can be only be used with a 24h/1day interval. This will probably change soon.
All the other “singular” parameters can be called with a 2month time interval.
Hello Radu,
I’m having trouble with my new portable unit; it keeps beeping at me.
Here is my “connect failure” data.
Issues found
Your computer appears to be correctly configured, but the device or resource (192.168.4.1) is not respondingYour computer appears to be correctly configured, but the device or resource (192.168.4.1) is not responding Detected Detected
Contact your network administrator or Internet service provider (ISP) Completed
Issues found Detection details
6 Your computer appears to be correctly configured, but the device or resource (192.168.4.1) is not responding Detected Detected
Contact your network administrator or Internet service provider (ISP) Completed
Windows can’t communicate with the device or resource (192.168.4.1). The computer or service you are trying to reach might be temporarily unavailable.
Detection details Expand
InformationalDiagnostics Information (Network Adapter)
Details about network adapter diagnosis:
Network adapter Ethernet driver information:
Description . . . . . . . . . . : Realtek PCIe GBE Family Controller
Manufacturer . . . . . . . . . : Realtek
Provider . . . . . . . . . . . : Realtek
Version . . . . . . . . . . . : 10.10.714.2016
Inf File Name . . . . . . . . . : C:\WINDOWS\INF\oem41.inf
Inf File Date . . . . . . . . . : Tuesday, August 23, 2016 7:12:06 AM
Section Name . . . . . . . . . : RTL8168H.ndi
Hardware ID . . . . . . . . . . : pci\ven_10ec&dev_8168&rev_15
Instance Status Flags . . . . . : 0x180200a
Device Manager Status Code . . : 0
IfType . . . . . . . . . . . . : 6
Physical Media Type . . . . . . : 14
InformationalNetwork Diagnostics Log
File Name: 2B40482C-0936-4FE7-8954-32A3B0F59F07.Diagnose.0.etl
InformationalOther Networking Configuration and Logs
File Name: NetworkConfiguration.cab
Collection information
Computer Name: DADS-DEN-REPLAC
Windows Version: 10.0
Architecture: x64
Time: Sunday, September 23, 2018 12:47:46 PM
Let me know where I goofed up and how to correct it.
Tnx and Best Regards,
Chuck w8dux
Hi Chuck, I will get back to you on email. Thanks
How do you change the country? I can change Lat/Long Altitude and City, but no matter what I do, it shows as China, with a Chinese flag.
Currently the dashboard doesn’t offer the option to change the country, but that will change soon. I changed it manually, please check and confirm.
When I clic to other taps than “Your Units” Nothing is changing, I need the API info but no way to get them? ;-(
Thanks, it is fixed now.
I’m seeing two units on my dashboard that don’t belong to me. I’m not sure how to remove them from my dashboard.
Those are demo units, for those that have no hardware but want to test the API. I can remove them if you want. Let me know.
Yep, please do. I’ve got hardware, I just don’t have it plugged in quite yet 🙂 Soon, I hope!
Done! Let me know if there is anything else I can do to help.
Hey Radu,
if you like please change the country to Germany on my device as well 🙂
Kinds Regards!
Done!
Thanks a lot!
My pleasure. Now you can change country / flag yourself, see the new Dashboard options.
Country option added to the dashboard, you can now set the Flag yourselves!!!
Hi there – have now received my Smoggie PM – super. Connected to my network but not visible in dashboard. Thing is, my PC is connected via LAN and my smoggie is wifi – but on same network. Is this the issue? What can I do to see my unit please.
Many thanks
Matthew
I can see the unit on global map but in config it does say IP and DNS not set?
I made my radiation raid and try to turn it on the network to be visible on the map. I have a problem such that there are some devices on my profile
ID
4100000A
82000034
I’m surprised because I do not have such devices and their locations are not in PL but in ro.
I have a question, how can you delete all devices in my SP3NX profile?
Regards Robert
I apologize for the translation but I use the translator.
Those are just Demo IDs so those that have no units of their own can test our API . Why do you want them removed?
How can users without units access the API? When I try to query one
curl -H “X-User-id:REDACTED” -H “X-User-hash:REDACTED” https:data.uradmonitor.com/api/v1/devices/8200013F
It tells me”Unit Not Allowed”
This isn’t my friends unit, as his is offline right now. But, I wanted to at least see what data other devices will return
Does user “REDACTED” own unit 8200013F? If not, it cannot access the data. You can check the units in your account on http://www.uradmonitor.com/dashboard . Let me know if you need more help, or more details on what you are trying to do.
Hello,
is it possible to change user key ? I changed password to my account, user key was changed too, but my devices went offline. When i changed password back, devices are still offline 🙁
Thanks
To change the user key you need to change the account password, like you said. But then you’ll need to reprogram your KIT1 units with the new key. If you change the password back, make sure the same User Key was generated.
I am using API and since february I get an error:
SQLSTATE[08004] [1040] Too many connections
Before it worked for years without any problems. Could you please check this!
Regards
Urs
hi Urs, thanks for the info. How frequently are you calling the API ?
I have three uRADMonitor devices and each is calling every 60 seconds.
Yesterday I have cleared the error and now it seems to work.
Notificarile la senzori…. cand o sa fie active?
Hello,
I have edit the parameters for 20FE8BB2.
There is a correct Latitude and Longitude, but it can not be seen as a green circle on the map. What can be the problem? How to solve it?
Thanks