
Tuning My Piano (ala John Barth’s “Floating Opera”)
I live in the USA’s Pacific Northwest. Until the last several years I never felt I needed a smoke particulate sensor. But a couple years ago, I experienced some chest pain and coughing after a wildfire smoke event that sent me to the hospital emergency room with a diagnosis of a pulmonary embolism which has put me on blood thinner medications for life.
Since then, forest fire smoke events have sadly become a regular feature of our summers – which should come as no surprise to anyone actually considering the effect of human activity on the carefully balanced environment that lead to our evolution as a species – but that is another topic… Our family started book marking a couple of websites for fire/smoke maps that proved useful in letting us know when to close up our home and remain quiescent in an effort to avoid further pulmonary embolisms and other possible deleterious effects of our smoke. It was a real step forward for us.
However, last year some new people moved into a home next door which had been unoccupied for many years. That home had a wood burning stove of some sort – no doubt one that dated from the home’s completion in the late 1960’s. We cannot be sure of exactly what those people decided to start burning in that stove or how the stove was (not?) maintained, but I can tell you the results of that were truly horrific – far worse than any wildfire smoke we had yet seen. The new occupants seemed completely oblivious to the impact of their behavior and we decided that we needed to take steps to prepare for legal action to force them to cease and desist. Since these events were completely local, they would never appear on any of the fire/smoke websites and we decided to purchase some sensors to capture local conditions.
I discovered the rather amazing Smoggie sensors when Radu commented on a post I make on the Reddit Air Quality sub describing this situation and asking what to purchase. Out of nowhere, Radu offered to help by sending me a Smoggie! I couldn’t believe it and was amazed at the display of the generosity and helpfulness that is all too rarely evident – and this time it came from far, far away. I remain truly awed by this even today. Figuring that it might take some time for the Smoggie to arrive in the USA due to the revolting behavior of our current administration with regards tariffs, I decided to purchase a Purple Air Flex sensor as well since delivery time was essential if we were to capture more of the neighbor’s abhorrent behavior with regards the wood stove.
Once our sensors arrived, I set them up along with a web camera pointed at the neighbor’s smoke stack in an effort to link the smoke readings with the actual output from that location and began capturing data (including that from a new weather station so I could also correlate wind direction and humidity impact on the smoke sensors). I have also added a second Smoggie to monitor indoor air quality.
Spoiler Alert –With some of the collected data/video in hand, my wife (who is far more diplomatic than I am) decided to speak with the neighbors about what we were measuring and the impact of the smoke on our lives. Thankfully, that behavior has now ceased entirely. But we still have air quality problems during the summer due to wildfire smoke. So the need to use our sensors has not really diminished – although it now seems limited to “summertime smoke season”.
The Opening Overture …
I tend to avoid dependence upon the web for my IoT devices – like the Smoggie and Purple Air Flex. Indeed, a major benefit to me of these devices is that both are easy to deploy and use simply over my router’s LAN. Basically, to see the sensors’ outputs, I merely have to point my web browser to the sensor’s assigned IP address (easy to do as I always assign fixed IPs to my devices). But – especially on a smart phone, this output can be difficult to see and assess. Also, since the Smoggie is an international device while the Purple Air Flex seems to have a special affection for the US EPA and our local AQ index, it was not easy to compare the data being produced by the two devices. Since I use my smart phone more as an IoT control panel than as a phone (I admit to horribly nerdish tendencies), I decided I could and should do better – to make the data more readily visible and compatible between the two sensors.
Hence my decision to use a home screen widgets on my Android smart phone. There are many ways by which this might be done. One could always write an app to do this – and indeed someone recently has done this for the Purple Air devices. But that Purple Air widget app relies upon the Purple Air web API and that wasn’t for me. I have noticed some references on the web to an app for uRad but that seems some time ago and I see no evidence of it any longer (this is no complaint – just an observation) so I have no idea of its capabilities.
Having written several Android apps, I might have gone this route. But I am getting older and far more lazy. I therefore started considering other approaches. Almost uniformly, these rely on other apps to do the “heavy lifting” and that is what I decided to do. There are many examples of such apps but as I have long used the outstanding Tasker app (https://play.google.com/store/apps/details?id=net.dinglisch.android.taskerm) for many of my IoT needs and since Tasker’s developer recently added a fantastic new feature called “Widgets V2”, that seemed an obvious choice for me.
For those who are not familiar with Tasker, it is an app for creating automated activities of your own design/need on an Android smart phone. Tasker entirely changed my relationship with my smart phone – turning it into more of a hand-held computer It has gotten ever more impressive over the years and I strongly urge others to consider it. There is a free, 7-day trial here (https://tasker.joaoapps.com/download.html) and the cost is amazingly low – a one-time US$ 4.49). Another fine mechanism for doing this (which I too use regularly) is an app call Kustom Widget Maker (https://play.google.com/store/apps/details?id=org.kustom.widget). It is free but function-limited until the purchase of a “key” app for US$6.99. Something like the widget described here could readily be made using only the free app. And I should point out that on Android there are other seeming possibilities that I have not explored including MacroDroid (https://play.google.com/store/apps/details?id=com.arlosoft.macrodroid) and IFTTT (https://play.google.com/store/apps/details?id=com.ifttt.ifttt) – which I believe is also available on iOS.
Tasker does require a learning curve but over time has been made easier to learn (there is a beginner mode) and can make impressive automations in very little time. There are tons of great sources for this on the web – far better than I could do here. One great place for help with Tasker after you have gotten started is the Reddit Tasker sub. But the dev is also fantastic at creating and posting videos on various Tasker functions/features. Here (https://www.youtube.com/watch?v=TQoH3jdyBgU) is one specifically about Widget V2 to give you an idea of how this works. There is also a video (https://www.youtube.com/watch?v=eOFY3JF5dP0) to describe the built-in visual Widget V2 editor that might be a huge benefit for the less technically inclined.
Finally, on to the song… (am I carrying the metaphor too far?)
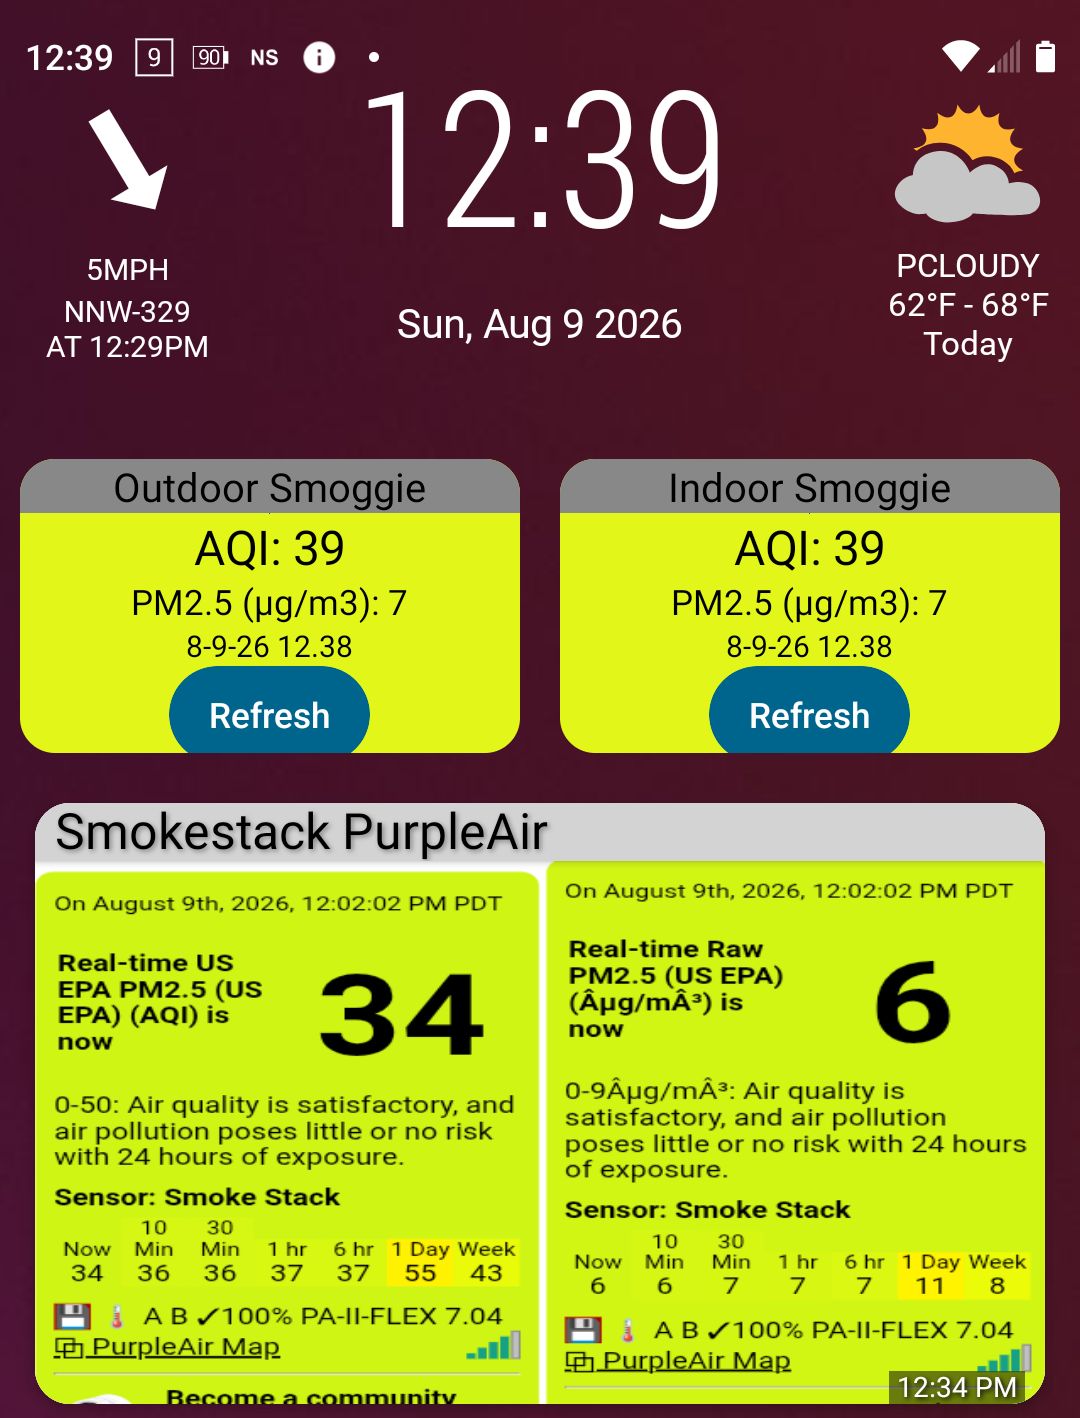
You can see the results of my initial efforts in the screen shot at the top of this article. The two Smoggie widgets are created using Tasker’s Widget V2. At this time, the Purple Air widget is created in an entirely different way – captured from the Purple Air website and displayed as an image in the widget. I will not go into that here – especially because I intend to replace it with a LAN-based, Widget V2 implementation when I get the chance.
The available Smoggie information goes far beyond what I needed/wanted to show in my widget. I really wanted to display only the raw pm2.5 concentration and the conversion of that value into a US EPA compatible Air Quality Index so only a quick glance is necessary to see where things stand at any given moment. You can see that I am displaying similar values on the right and left sides of the Purple Air widget.
Doing this was easy enough in Tasker, I simply have it issue an LAN http GET request (http://SmoggieIPHere/j) every 2 minutes to retrieve the Smoggie’s data in the more easily processed JSON format. Tasker has many built-in JSON-related functions so getting the pm2.5 concentration reading (data.pm25) is a breeze.
Everything else is really just formatting the data as you would like it to appear in the widget. In my case, I first needed to create a series of steps to take the raw pm25 data and use it within a formula to create the US EPA AQI value. I was able to find code approximating this on the Purple Air discussion forums – see (https://community.purpleair.com/t/how-to-calculate-the-us-epa-pm2-5-aqi/877/14). But I later learned that the breakpoints between the hazard levels had been changed by the US EPA – see (https://community.purpleair.com/t/have-the-epa-pm2-5-breakpoints-changed/22858/3). So I had to make a few minor changes to be up-to-date with what the Purple Air website displays.
A bit more confounding was how to make the widget’s background colors – that reflect at a glance the hazard level) match those shown by the Purple Air website. I originally thought of these as simply: green, yellow, orange, red, etc. But I realized that these simple color values did not end up matching the colors shown by Purple Air. Some closer observation made me realize that, as the current AQI value increases across the level’s range from low to high, the level’s basic color – in the above case, green, was being blended with the color used for the next higher level – in the above case, yellow. So I introduced some steps to “blend” the two colors based upon a percentage that increases as the current AQI moves within its range. That did the trick, it seems. Now the two colors are a very close match.
You cannot see it in the screen shot, but I added a response when the user taps the widget’s title bar to open the full Smoggie web page in my browser. I also added the refresh button at the bottom which, when tapped, simply triggers the same mechanism that Tasker is running every 2 minutes. All of this, however, is just fluff and more a reflection of my fooling around with the Widget V2 mechanism than anything else.
I could publish the entire contents of my Tasker efforts here. But I am already running on and on. Thankfully, Tasker makes it easy to export a “project” from my phone and import that project into a “project” on your phone. So I will go that route instead. You can find that here (https://drive.google.com/file/d/1t0rblnabJhIIuxd5smdIQWFLCCFv-nV3/view?usp=sharing) for the time being. When imported, you will now see a project called Air Quality in Tasker’s main page. Inside of that project are “profiles”, “tasks”, and “variables”.
Think of the “profile” as the automation’s trigger – ie, running the “task” to update the widget every 2 minutes.
Think of the “tasks” as parts of the automation’s actual work – updating the widget’s contents. I have two Smoggies (indoor and outdoor) but I have simplified the “project” linked above to show how I create only one of them – expanding to more is very easy to do. The “task” that is triggered every 2 minutes is named “AQ Smoggie Widget” – I am not that creative with names…
Finally, Tasker supports global “variables” – vars for short which allow data to be shared between “tasks”. In this simplified “project” I am using only one just to demonstrate how vars can be used. Tasker does NOT include the data contents of these variables when the “project” is exported as I have done here. In this case of the variable holds a constant value for the Smoggie’s IP address so this is no real problem as the IP addresses of my Smoggie will be of little value to you. Yours should be something like 192.168.1.64 or similar – it is the address of your Smoggie on your home LAN. This is why using fixed IPs is very handy. (Note: in the exported “project” you will see a strange “var” – %02X – this is really not a “var” the “project” uses – it is an oddball side effect of how Tasker names/recognizes “vars” used in “tasks” – so please just ignore it.)
Of very great importance is the final “Widget V2” action/step in the “task” called “AQ Smoggie Widget” as its Custom Layout field contains the widget format information used to produce the widget’s appearance on your home screen. I have included it directly below. This data is in JSON format, so you need to be careful to maintain its proper formatting or the widget’s update will fail.
BEGIN JSON
{
  “type”: “Column”,
  “backgroundColor”: “%smoggie_color”,
  “horizontalAlignment”: “Center”,
  “verticalAlignment”: “Center”,
  “scrolling”: false,
  “children”:
  [
    {
      “type”: “Row”,
      “backgroundColor”: “grey”,
      “fillMaxWidth”: true,
      “horizontalAlignment”: “Center”,
      “verticalAlignment”: “Center”,
      “scrolling”: false,
      “children”:
      [
        {
         “type”: “Text”,
         “textSize”: “16”,
         “align”: “Center”,
         “task”: “AQ Smoggie View”,
         “taskVariables”: { “par1”: “http://%widget_ip” },
         “text”: “%widget_title”
        }
      ]
    },
    {
      “type”: “Grid”,
      “horizontalAlignment”: “Center”,
      “verticalAlignment”: “Center”,
      “fixed”: 1,
      “children”:
      [
        {
         “type”: “Text”,
         “textSize”: “19”,
         “align”: “Center”,
         “text”: “AQI: %smoggie_aqi”
        },
        {
         “type”: “Text”,
         “textSize”: “14”,
         “align”: “Center”,
         “text”: “PM2.5 (µg/m3): %http_data.pm25”
        },
        {
         “type”: “Text”,
         “textSize”: “12”,
         “align”: “Center”,
         “text”: “%DATE %TIME”
        },
        {
         “type”: “Button”,
         “text”: “Refresh”,
         “enabled”: true,
         “buttonType”: “Filled”,
         “task”: “AQ Smoggie Widget”
       }
     ]
    }
  ]
}
END JSON
Details on the Custom Layout JSON can be found here: (https://tasker.joaoapps.com/userguide/en/widgetv2_custom.html).
Because I have two Smoggies, I have 2 widgets. But in my case the Custom Layout of the two are nearly identical. Only some data values differ so I employ Tasker variables. Anything you see in the above JSON that starts with a percent sign (%) is a Tasker variable and Tasker will replace it with the variable’s current value.
For example %DATE and %TIME are replaced by Tasker with the current date/time as seen in the widget.
Similarly, %http_data.pm25 is replaced by the pm2.5 data retrieved from the Smoggie’s json in the response to the http GET query that Tasker issues.
%smoggie_aqi is replaced with the results of my computation of US EPA Air Quality Index and %smoggie_color is replaced with the results of my “blended” color computations so the widget’s background color matches that shown in the Purple Air widget.
The finale… (I AM carrying the metaphor too far!)
I apologize for the length and complexity of this article. I have never been good at editing myself…
All of this is likely more complex than need be. And it may seem a lot to digest at first. It is! But I wanted to show something that is very real-world, not dumbed-down, and that demonstrates at least a fair amount of what can be done with Tasker and its Widget V2 functions. Once most people get their first actual Widget V2 going, it does not take long for them to polish/improve the first attempt and to go on to do much, much, more.
So please review the videos shown above. Please feel free to ask the great folks on the Reddit Tasker sub. I poke around there a bit myself. So you may hear back from me directly.
Best to you all!
David

FYI – I updated the Tasker project code linked above int Google Drive on 8/14/2026 @ 9:00am. It fixes error in color blending. Best!