Forum Replies Created
-
AuthorPosts
-
uRADMonitor
KeymasterCurrently the new website is under development. This will also offer the API discussed here. As an estimate I’d say one more month if all goes well.
-
This reply was modified 11 years, 2 months ago by
uRADMonitor.
KeymasterHi Coos,
Glad that this solved the problem. Good to know for the future in case anyone else happens to use Fritz!box routers. I merged the two topics together to have all information in one place.
Radu
KeymasterOk, looking forward to that. Thanks!
KeymasterJust as a note, the uRADMonitor units have a watchdog mechanism, that reboots the unit in case of no successful server communication in a 5minutes interval (that totals 5 attempts, as the units send out measurements every minute).
KeymasterHi wiretap, that is an excellent setup!
I have changed the coordinates as per your request.
To access the unit directly, you’ll need to use the ID as uppercase:
KeymasterDo you have / or can get, any other portable dosimeter to run a parallel test?
The max level reached in your basement is not a concern, still it should be a good idea to double check it.
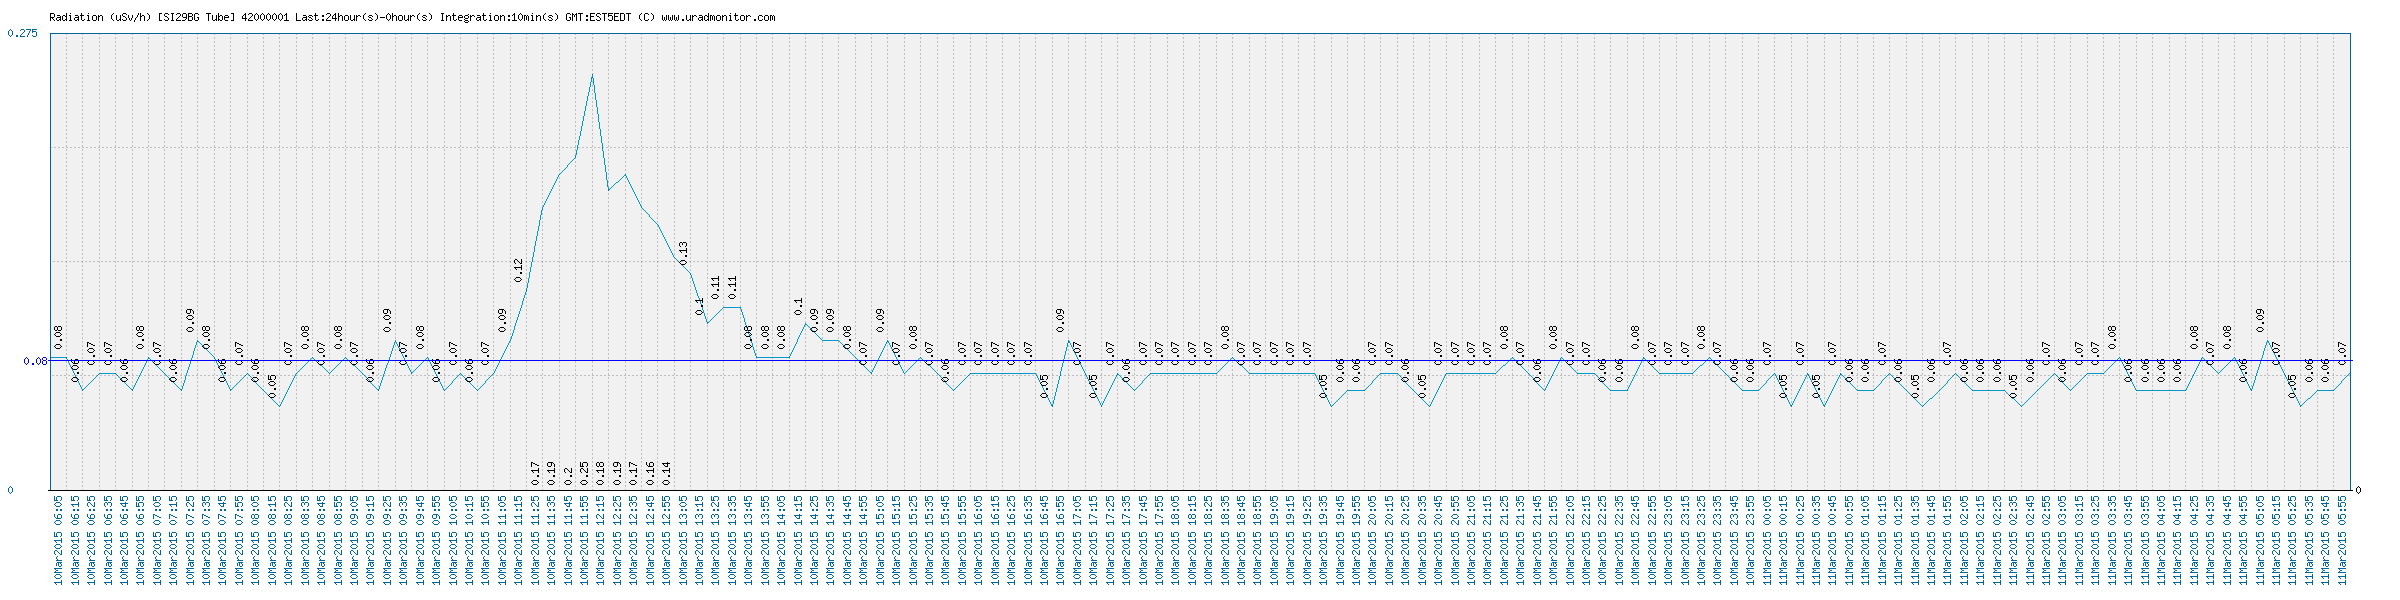
KeymasterI see it decreased, why?
Attachments:
KeymasterWelcome wiretap, and looking forward to your feedback once you get your unit.
KeymasterSounds good, thanks for the update!
KeymasterThat is some great stuff you did there, Rick!
If you are in the mood for writing a short article, you could present your Home automation system on the blog, I’m sure many would be interested in reading about it.
I believe your account is already setup for blog access.
KeymasterScott, your account should now be able to write blog posts. Feel free to give it a try!
February 27, 2015 at 7:23 pm in reply to: Documentation of graphing script + user input validation #1456KeymasterIt looks good, we will have something like that soon.
KeymasterFirmware v111 is now available, see: https://www.uradmonitor.com/new-firmware-v111/
Keymastershogunx, for something as useful as this, let me know if you would like to do the version control in a blog post instead.
KeymasterJust an update, to let you know that the server API is changing to a REST model, and so will allow easy configuration for any custom units. So we’re getting closer to what you all have requested.
-
This reply was modified 11 years, 2 months ago by
-
AuthorPosts