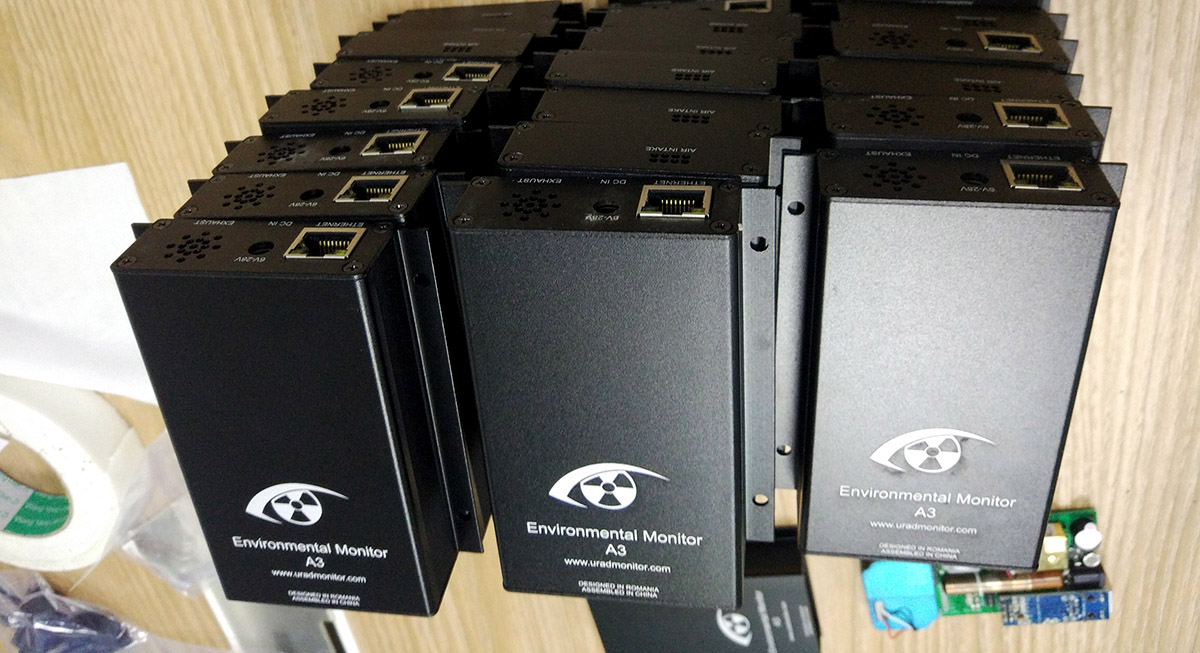
The uRADMonitor A3 was first anounced two years ago. During all this time, the product has seen multiple iterations that continuosly improved the hardware. The high number of sensors and the robust design were appreciated among our users. The A3 spread at a fast pace, quickly becoming one of the uRADMonitor most successful designs. To meet the increasing demand, part of the production was outsourced to China, not before strict quality control mechanisms were put in place. The batch of units sponsored by the successful second indieGogo campaign were also scheduled for manufacturing in China. This post is a production log, to present some technical details on the entire process.
The hardware iterations
This article illustrates the HW105 variant, the fifth A3 iteration. But before we got here, there were other 4 A3 variants.

It all started with an initial concept. The first version, HW100 was fast prototyped and developed in less then 2 months, including the PCBs, the aluminium enclosures and the firmware. The product was voted Winner of Innovation labs 2016 and this resulted in interesting collaborations with Orange Romania for the Smart City sector.

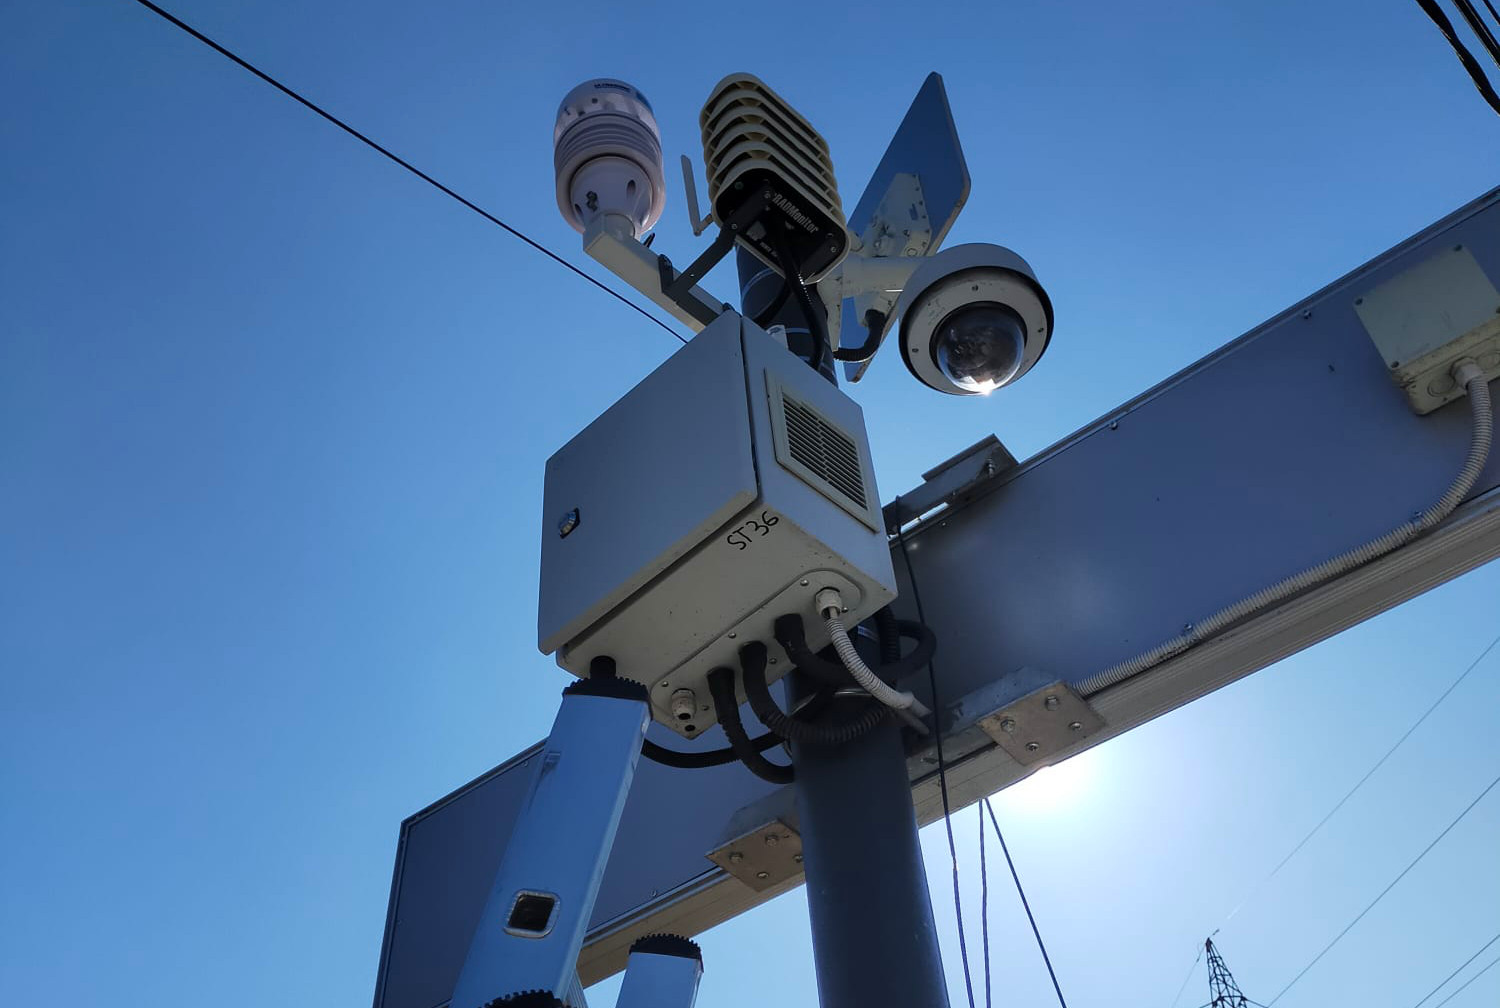
Then the next versions added a DC converter so the units could be powered with anything between 6 to 28V and most important 4 connectivity options instead of the initial Ethernet only variant. Now the device would measure a high number of parameters via high quality sensors: PM2.5 (Optoelectronic sensor), CO2 (NDIR), Formaldehyde (Electrochemical), VOC (MOX Sensor), Temperature + Pressure + Humidity (MEMS sensor), Ionising Radiation (Geiger tube with 400V inverter), Noise pollution (sensitive microphone with amplifier). Using the 4 available connectivity options and the low power consumption this device could be deployed in a large variety of field applications. And all this in a tiny aluminium box, about the size of the hand.

Data access
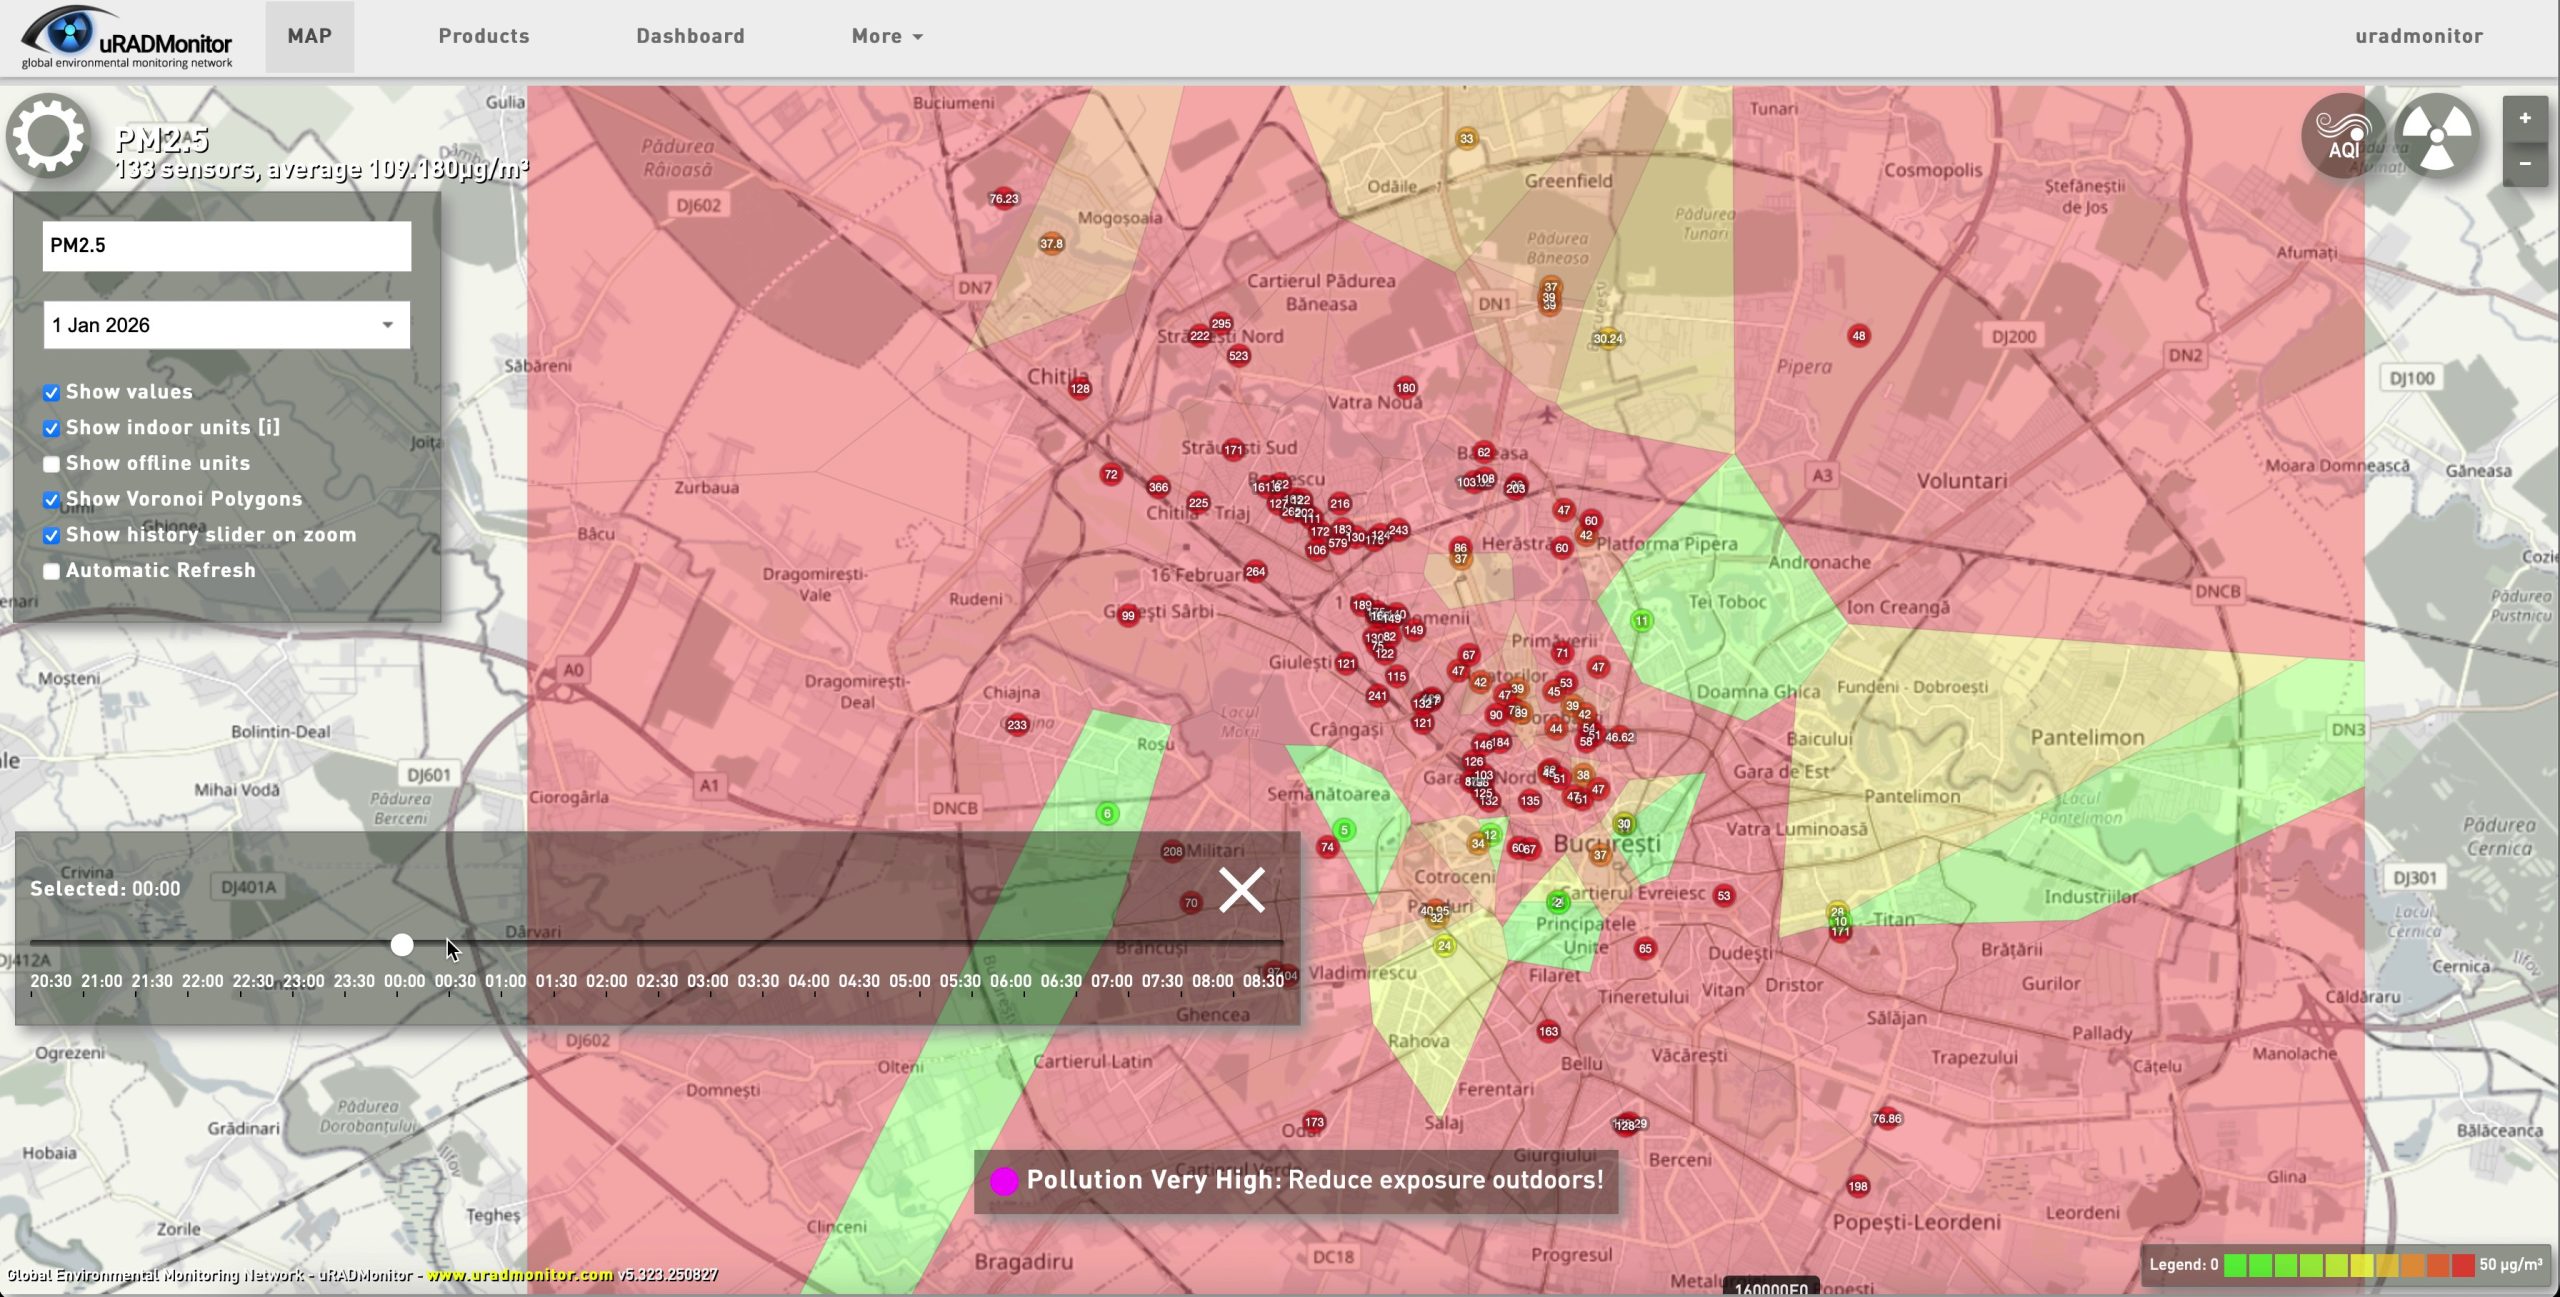
The data generated by the A3 is available via the dashboard. A powerful RESTful API is in place so you can integrate the A3 to applications like home automation, city management platforms, research and more. The are examples to get you started right away, and the data can even be accessed as data sets, in CSV format:
Producing the uRADMonitor A3
The A3 production, like with the other uRADMonitor products, focuses on several key components: the PCB, the assembly, the aluminium enclosures, the sensors, the firmware and the testing. These are done in separate factories. Due to popular demand, this article will show some details on the entire process below.
First, the PCBs are being manufacured. These are standard FR4, 1.6mm thick dual layer boards and for the A3 there’s a green soldermask and white silkprint. The other uRADMonitor boards use different colours, for example the KIT1 is red.

For these PCBs, a stencil is also being made, a kind of a perfored plate by which the soldering paste is applied. The perforations are made to match the solder pads of the components. This offers speed in applying the soldering paste. The process can be manual or automated, depending on quantity.
The result is a nice layer of solder being applying uniformly on the soldering pads. These pads are the points where the electronic components will adhere to the board:

Next, the electronic components need to be carefully placed on their respective pads. They are small, so this process needs to be done carefully. Best option here is a pick and place machine. For the current production lot, two machines were used to populate the boards:

After all the tiny components are in place, the boards are inserted in a special hot oven, another big machine that brings the temperature to a controlled level, enough for the soldering paste to melt and encapsulate the components.

The hot oven does the magic. The gray soldering paste turns into a beautiful silver solid, and the boards are ready.

Here is a closer look on one of them:

Beautiful, isn’t it? In this form they are called PCBA, or “assembled PCBs”. But the process is not over. These boards still need some visual inspection, for bridges or any other minor defects that need to be corrected. The soldering paste can sometimes flow to nearby components creating shorts. The boards will also undergo cleaning, where they are inserted in a bucket of strong solvent to eat out all the soldering flux.
When the PCBA’s are ready, the next step involves soldering the big components and the sensors before the actual device is complete. This is usually done by hand, as with the uRADMonitor A3, the many complex sensors come in different sizes and also require great care to avoid any contamination. First goes the Formaldehyde sensor and the Geiger tube:

The carbon dioxide NDIR sensors in their highly reflective golden coating, are carefully added to the setup:


Finally, the last sensor, the bigger Particulate Matter laser scattering sensors are added:

The Aluminium enclosures
The rugged aluminium enclosures were another important component. Initially, they were designed with round shapes, but the need for a wall mounting support became evident and that is what we have now.

The aluminium processing involves cutting from existing profiles, drilling, milling, anodizing, engraving, silk printing . All this needs to be done with minimal errors so everything will eventually fit together. We used a professional factory for this too, after doing the 3D enclosure design ourselves:
The engraving process was also completed, and here are the nice final boxes, with a high quality white silkprint that doesn’t wear off in time:

Testing and calibration
Now the many lines of code that control the behaviour of these units are poured in the microcontroller in a process that is called burning the firmware. There will be 100 firmware files, compiled with an automated script, so that each one has a unique ID.
With the firmware installed, everything is verified for correct functionality. The units are connected on the work bench for several minutes, in parallel. The more the better as their data becomes more relevant:

The test verifies nominal values for the sensors, so the data is plotted in a chart and compared against a master reference:

Because of the quantity, an automated process is required, since the human eye can overlook various small but important details. Here’s one such tools that tests all connected units in parallel. The system identifies problems based on the readings, and informs the test engineer. The units receive clearance only when all the red lines turn to green and any errors are gone.

This test tool gives the green light on the units that meet the testing criteria:

This automated testing tool is a valuable asset to the testing procedure. If any sensor is found to be defective, it is replaced at this step.
Finally the units are then installed in their aluminium enclosures, so they can be tested in their final form:

Again, they are connected to the Internet, and the data they generate is checked against a common reference. A visual tool shows the data in charts:

With so many parameters generated by the A3, this becomes a labourious task because all the parameters need to be checked individually: temperature, pressure, humidity, voc, co2, formaldehyde, pm2.5, radiation, noise. Here another tool is used to adjust some predefined offsets and make sure the data output is properly aligned to the reference values:

The picture above shows the initial uncalibrated output from several units running in parallel, and the result of the calibration process properly aligning the output. The reference can be the average of all the data streams on a given time interval, or a value obtained with a third party professional dosimeter to align the A3 output to (ex. CO2 dosimeter, Geiger Counter, etc).
Finally we’re ready!


Certifications
With the above we should have everything in place. But the struggle is not over. For the product to be legally placed on the market, several certifications need to be obtained. For the European market, the CE certificate is obtained in specialised facilities where the devices need to pass multiple tests. For the A3 we had to get the CE-RED because it is a Radio device. This is also more expensive.

The final CE-RED test report is a total of 296 pages, all of which are summarized by the following certificate:

Then there’s also the certifications that make us proud, such as the Arrow Certification we received for the uRADMonitor A3, part of a list of 160 projects with 219k backers and $41.1M raised.
Future directions
The A3 is essentially an Air Quality monitor. The upcoming version, codenamed HW106, drops the Geiger tube and adds an Ozone sensor. It offers an additional micro USB connector, that can be used to provision the unit (WLAN/LoRaWAN/Settings) or for data access. It comes in 6 variants, adding a WLAN variant with internal antenna and one with Bluetooth Low Energy that you can connect to your smartphone directly. All sensors are being read digitally, improving accuracy. The microcontroller has be upgraded to a more powerful one, to support the new features. Also, the new variant will support the power save mode, allowing power consumption of as low as 18mW while in idle mode! An alkaline AA battery has an energy of about 3.75Wh, so it could power an A3 for about 208 hours or 8.6 days.

A word of ending
This long term development would not have been possible if it wasn’t for all the great people and communities that helped along the way. It started with elforum.ro, 4hv.org, Hackaday, Dave @EEVBlog, the uRADMonitor community, Innovation Labs and last but not least the Innovation department of Orange Romania. And most likely this is not the complete list! Thank you all.
codemore code
~~~~