Forum Replies Created
-
AuthorPosts
-
SaltoUYStation
ModeratorGuess it takes a few minutes for the server to reflect that my system is back (map shows grey diamond). Though, my unit does display as online.
…
still wasn’t showing up- so, I unplugged the power cable from the energy source and plugged it into a different outlet, and, voila! The unit is now showing as a colored dot on the map again.
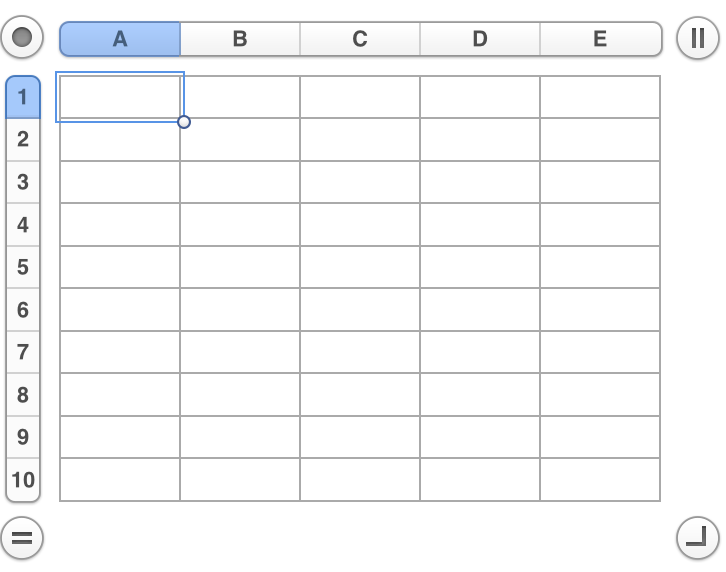
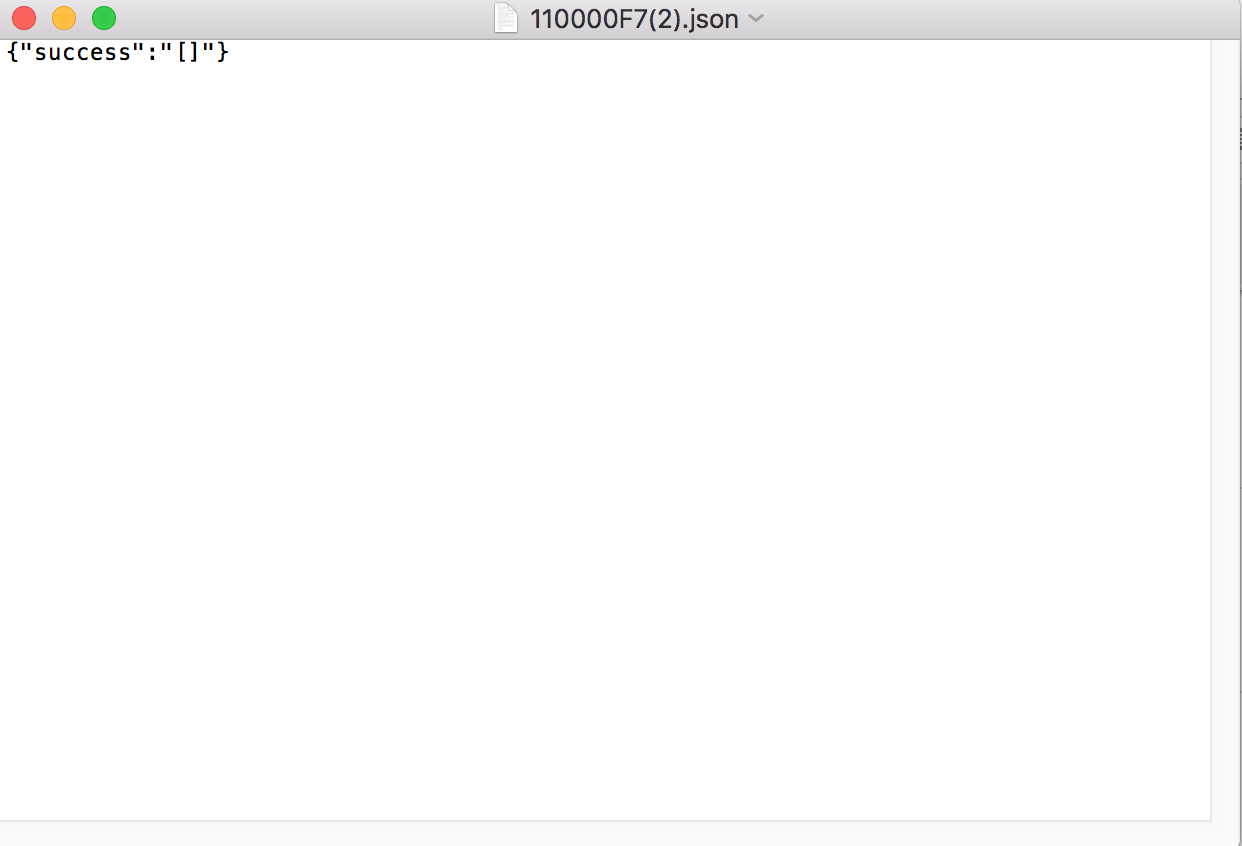
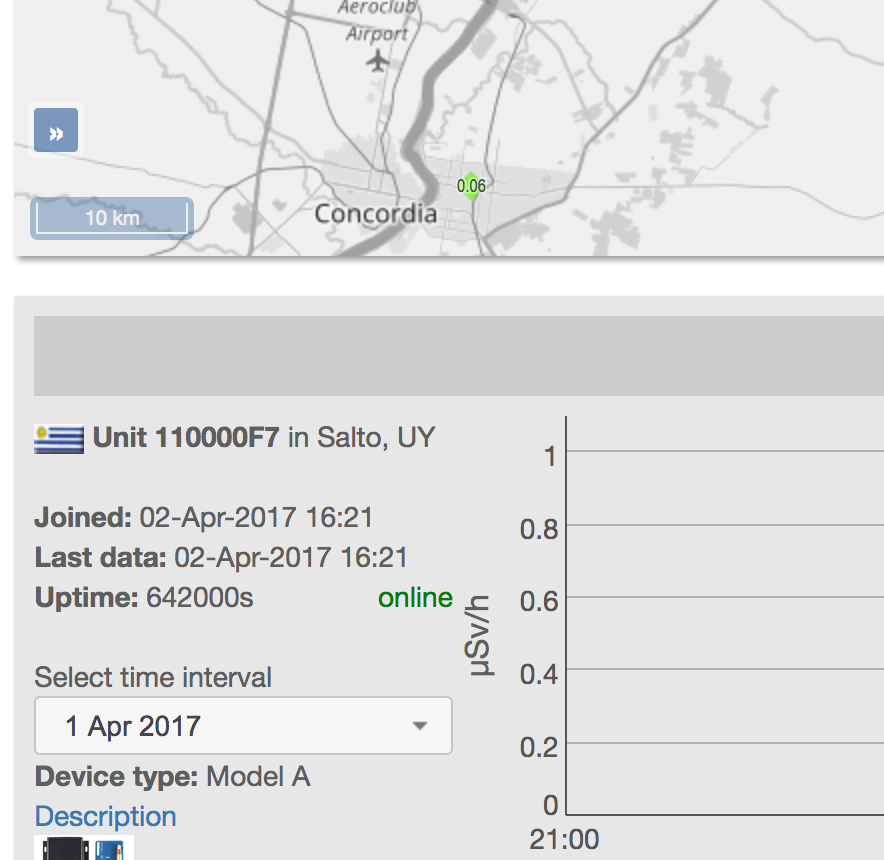
ModeratorThanks, Radu. Here’s some relevant screenshots. I’ll reboot my router and unplug Model A, start fresh, see what happens. Graph for 2 April is empty like graph for 1 April.
ModeratorHello Radu, yesterday, or the day before, I noted that the temperature data wasn’t displayed in the online graph anymore and today graphing of radiation data isn’t occurring, either. And, when I download both JSON and CSV, no data downloads, blank docs. Just an FYI.
ModeratorGreat to be here, Radu! Thanks for bringing me in. 🙂
…
13 April – Thank you, Radu for all you do and for granting me moderator status. I’m humbled and will endeavor to learn more about the technical aspects of your products so I can be of more help.ModeratorYes, the data is still posting continuously – it was a cat thing the other night. Need to build a special shelf they can’t access for the router and cables to tuck into.
ModeratorAwesome, thanks! Aha, so, much easier using JSON or CSV… cool. Will explore the other tools.
ModeratorNo worries and thanks so much! You are doing a great job. I imagine you have a lot to do. Too bad you can’t clone yourself, aye?
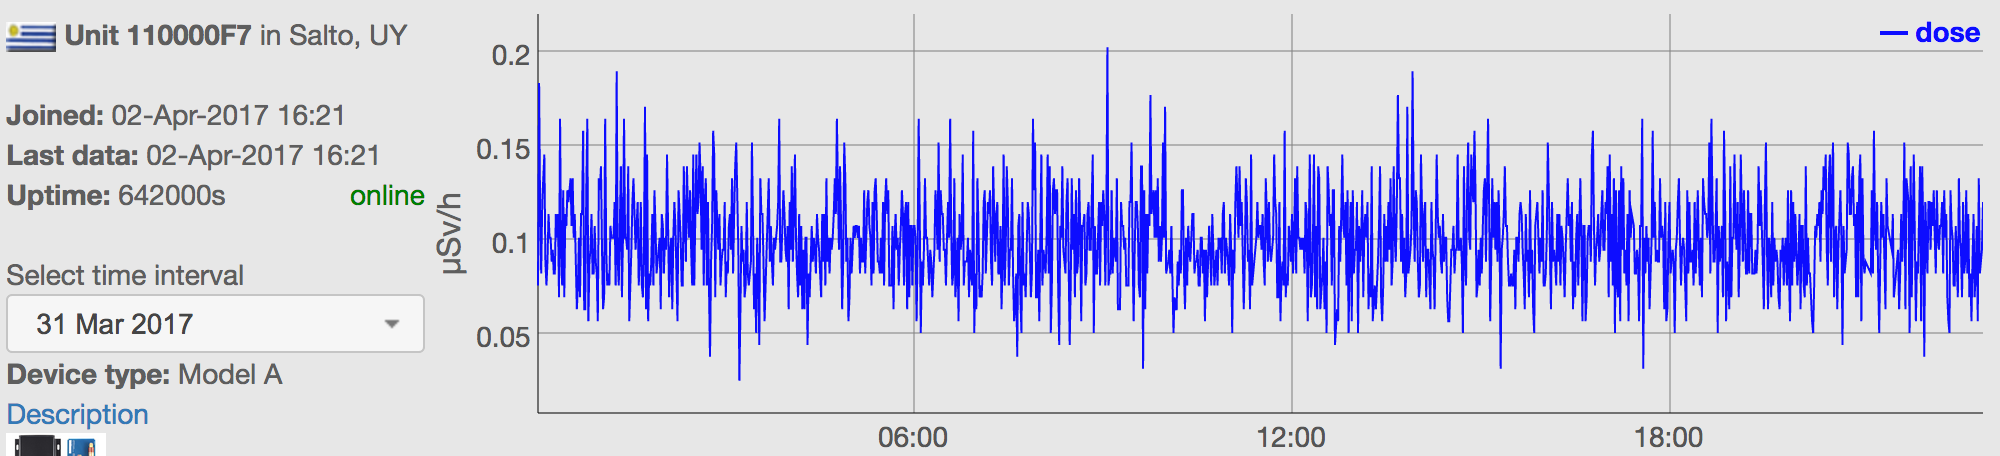
ModeratorSometime after 2:12am (UTC) (11:12p UY time) the power disconnected – when I woke later I discovered this and reconnected the power. Likely a failure of a cat to maintain their enthusiasm. When I looked at my data in urad, the chart actually was graphing the radiation counts. After I reconnected the unit, the graphing ended.
Moderatoroops… something’s up (or back) with my timestamps…
Attachments:
ModeratorSweet! Thanks so much, Christian, really appreciate it, never was good at math, makes my head hurt… lol. ~ Pia
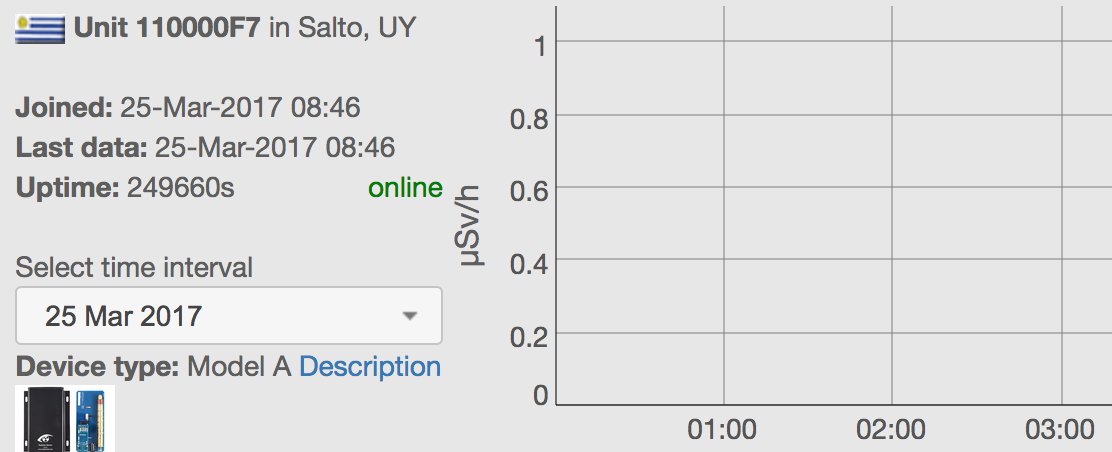
ModeratorAt 09:49 I’ll do another download to help me figure out the time correlation… but, I’ll probably still need some guidance, not knowing at what time the data capture is in relationship to the download time… thought I could help myself by capturing the joined date/time, but it reflect today’s info… 25 March.. my uptime is 253080s (that’s seconds, right?)
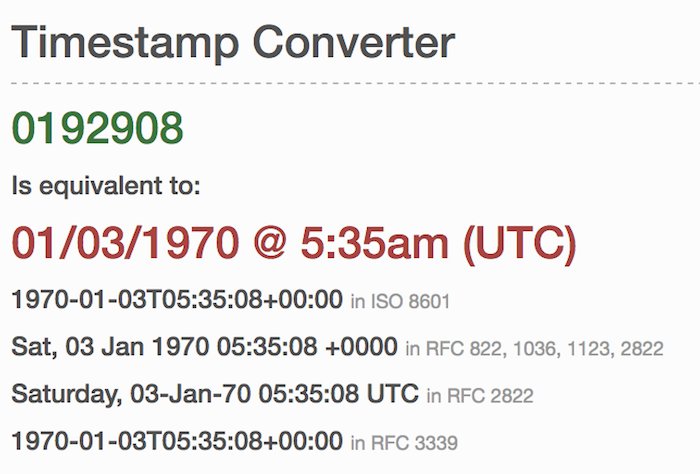
ModeratorHi Radu, I’m trying to figure out the actual time of the timestamp in data reports… For example I downloaded data at 08:49 on 25 March 2017 and it reads:
1490410770 -31.381897 -57.951878 35 27.5 11 377 350
How do I decipher this? 1490410770 is there a table showing time stamps and real time? Like a celsius to fahrenheit conversion table. Thanks!
ModeratorHi Radu, I see that in my chart the temperature data is on the graph, but the radiation data is not registering… doI need to do something with API to get the data on the chart? Thanks!
Attachments:
ModeratorThanks for the quick fix, Radu! Now transmitting from Uruguay and on the map in South America.
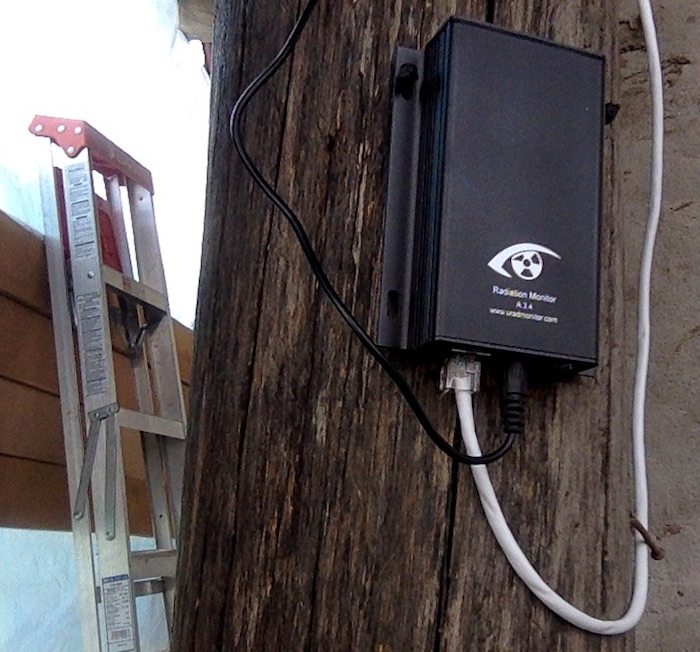
ModeratorForgot to note that I have the monitor outside, three feet above the ground and attached to a corner post of the house under a balcony – it’s a breezy space protected from the rain and is on the SW corner of the house. Unit number is: 110000F7 (currently showing up in China, soon to be in Uruguay) < ( __ ) >
Attachments:
-
AuthorPosts