Home Forum Software Documentation of graphing script + user input validation

Viewing 4 posts - 1 through 4 (of 4 total)
  • Author
    Posts
  • #1437
    Bjorn Roesbeke
    Participant

    A PHP/GD generated graph is shown for each monitor on the map.
    For example, one of the graphs for my unit is: https://www.uradmonitor.com/data/0.1/public.php?id=1200003F&param=temp1.
    Out of curiosity i tried to change these variables to other values and i also tried to guess at some other arguments to retrieve graphs of other durations etc.
    “What if i try temp2?”, “what will happen if i type in a random id?”, “can i change the language?”, “can i change the time to last week?”,…

    Most of the results were empty charts.
    However, i did notice that values such as id seem to be drawn on the graph as-is. There’s no error message displayed, seemingly no multibyte support and not too surprising, characters such as a nullbyte are interpreted as a control character. I’m far from an expert on PHP or security but you might want to look into it.

    Is there a page where all possible arguments and functions are documented? Better yet, is the source code available?
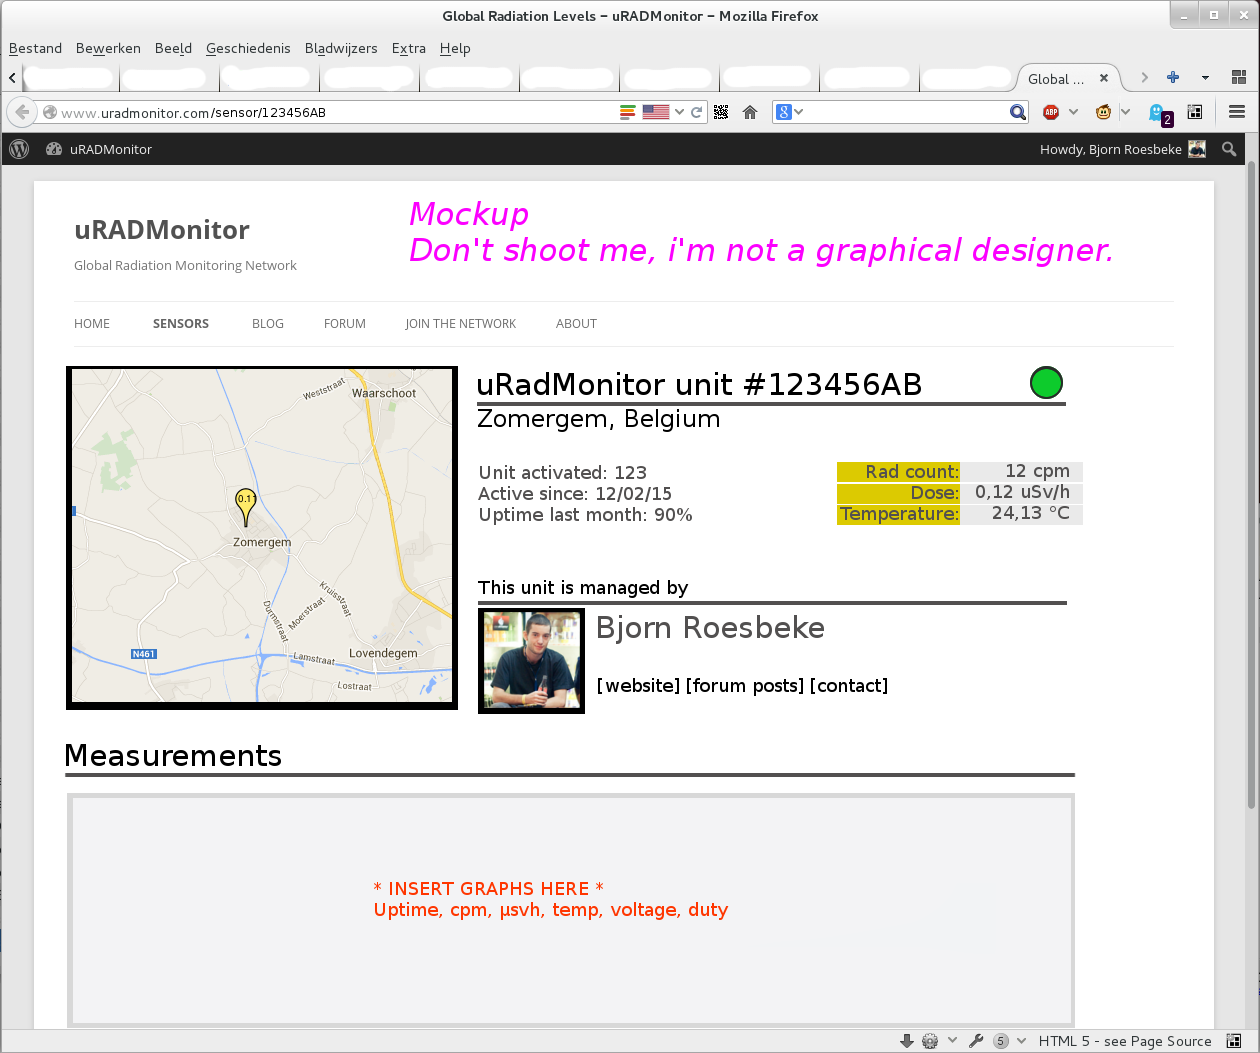
    Lastly, can i request static HTML pages for each unit instead of having to load and process the Google maps? Believe it or not, sometimes it locks up my browser and on mobile devices it’s not the best thing either.

    I’m not trying to demand anything or complain, i am curious and excited about the project. That’s all.

    #1440
    uRADMonitor
    Keymaster

    Thanks Bjorn,

    There’s some documentation on the parameters used for this simple initial API, here: http://www.pocketmagic.net/uradmonitor-online-remote-radiation-monitoring-station/#details

    You’ll just need to change the URL.

    The entire solution is moving to an RESTful API as we speak, the upload is done, and so will be the data query, hopefully also closing the security issues. I am taking everything one step at a time.

    There is also a script for accessing minute resolution data, let me know if you are interested in that as well. About the static HTML pages, I’m not quite sure what would you like to see, please detail.

    • This reply was modified 9 years, 2 months ago by uRADMonitor. Reason: typo
    #1453
    Bjorn Roesbeke
    Participant

    As i said before, Google maps with many pins sometimes pegges a CPU and the current detailed view is _inside_ of the Google maps.
    The static webpages i spoke of might be something like the attached image.

    #1456
    uRADMonitor
    Keymaster

    It looks good, we will have something like that soon.

Viewing 4 posts - 1 through 4 (of 4 total)
  • You must be logged in to reply to this topic.