Recently I was researching into home automation systems. What I wanted to do was have temperature sensors in different locations around my house and integrate this environmental information into one place, where the data could be logged and monitored. What I discovered was open source software called Home Assistant.
I had a spare Raspberry Pi 3 B+ and wanted to put it to good use. I downloaded their 32-bit installation file from the Home Assistant website (or “Hassio” as they are also known). I used a 64GB MicroSD card for the install. Hassio recommend a minimum 32GB (as the system does eventually hold a database of all your sensor data on it. The bigger the space, the more data it will store).
The temperature sensors I decided to go with were called Xiaomi Mi Temperature and Humidity sensors. They are simple in design, but crucially also bluetooth enabled.

However, Home Assistant does not directly “see” these temperature sensors. Another piece of kit was required, called an ESP32. It’s a tiny circuit board designed for tinkerers and developers. The tiny USB-powered ESP32 is a wifi and bluetooth enabled device that can be programmed to analyse your home wifi network as well as any nearby bluetooth devices. I connected the ESP32 to my laptop and ran software called ESPHome-Flasher. This opened the device communication, and allowed the device to show me what bluetooth devices it was seeing. Every time one of the temperatures updated, it appeared in the ESPHome-Flasher window, along with it’s MAC address. I was then able to create a firmware specific to reading only the MAC addresses I want (and ignore the rest). In my case, I created a firmware to only accept the MAC addresses of my two sensors, and then push that data to Home Assistant.
The following YouTube video was incredibly useful for assisting in putting this together: https://www.youtube.com/watch?v=RtJpx8BZvMw

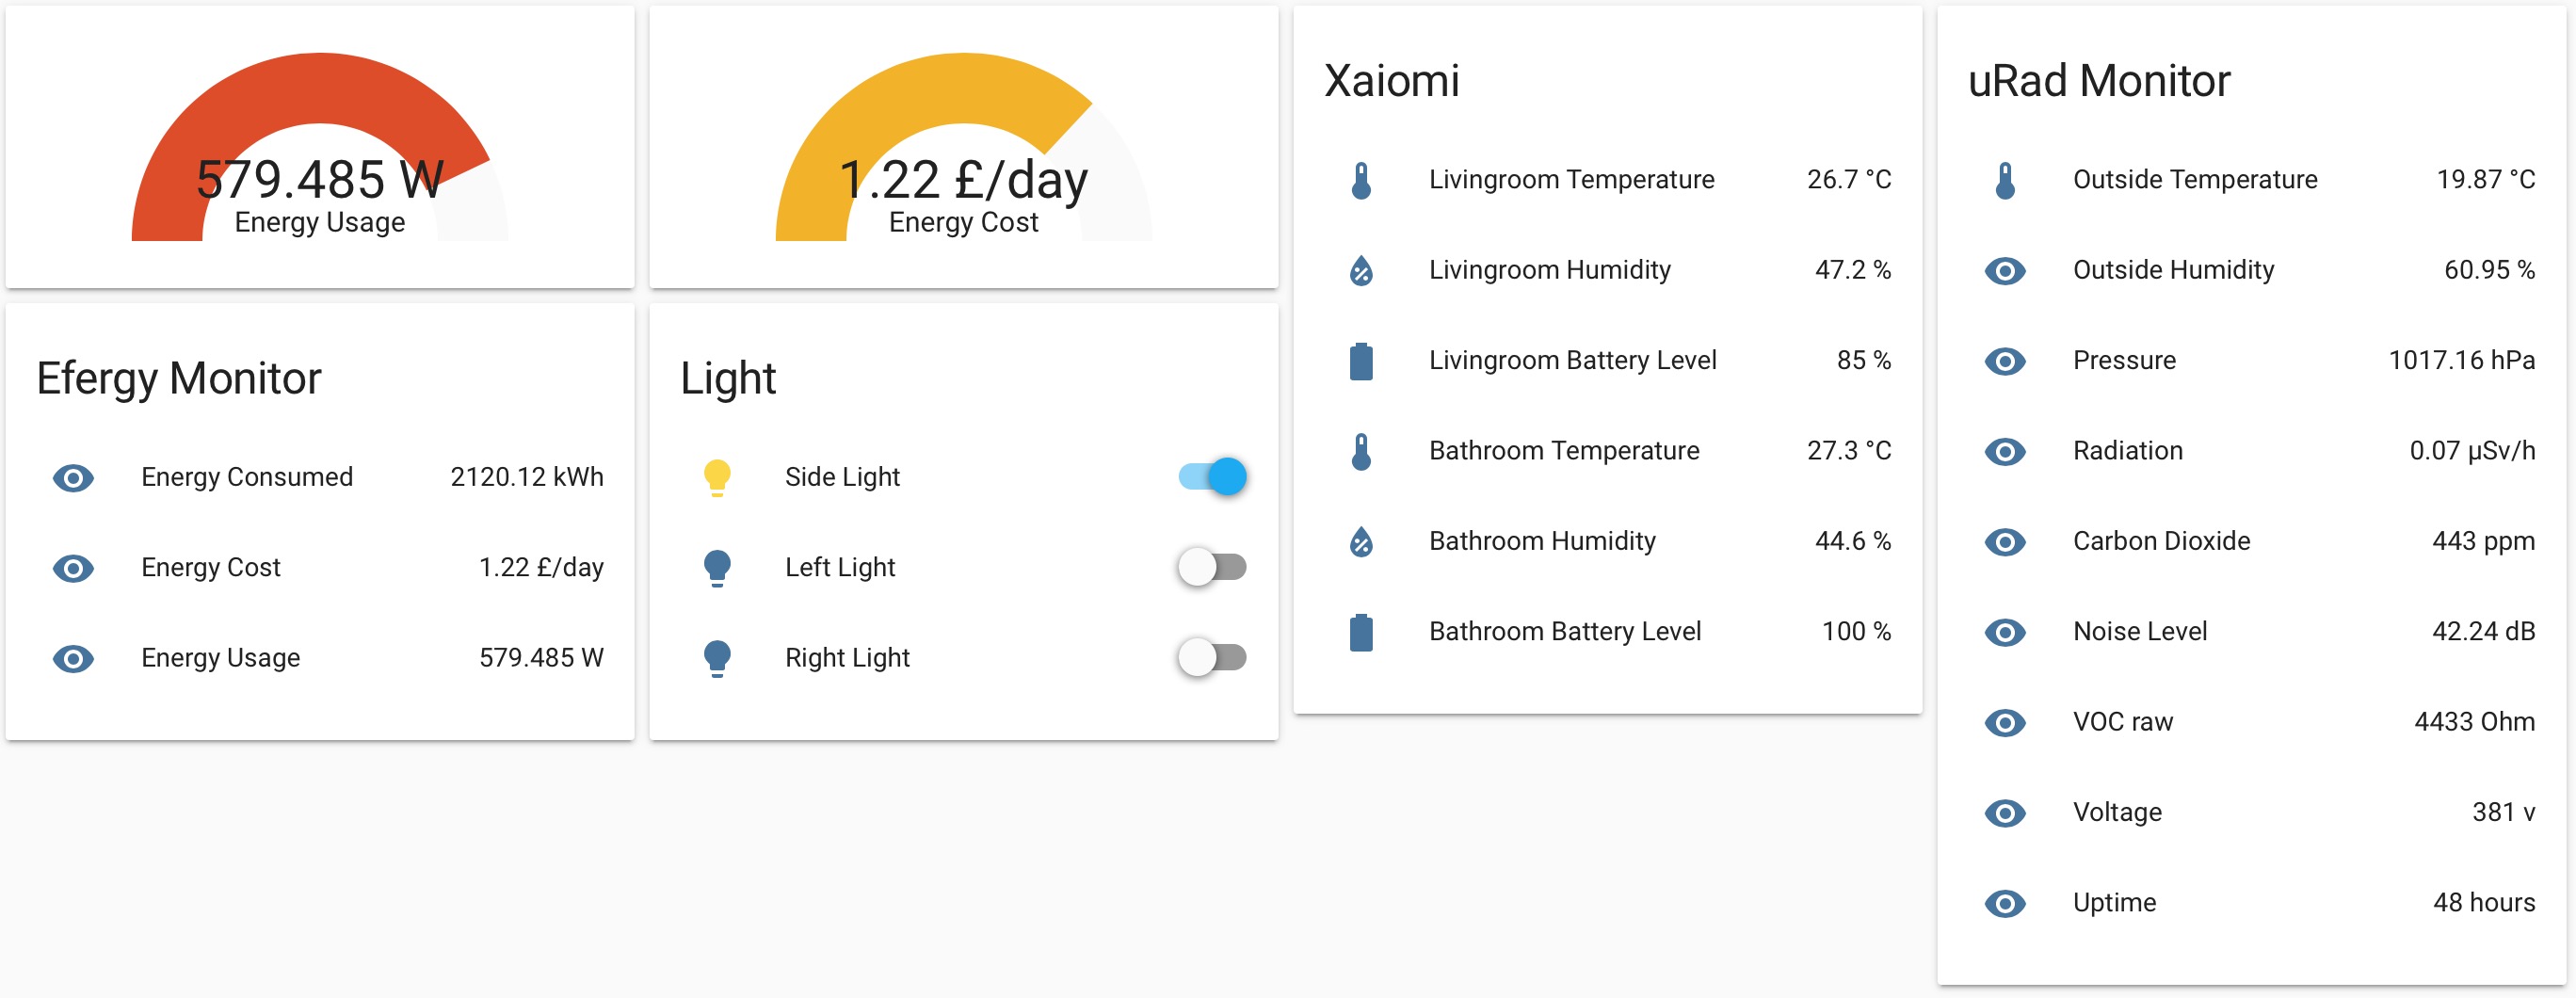
Once the ESP32 was set up, it simply read the temperature and humidity data from the two Xiaomi devices, and then reported it back to the Home Assistant. Home Assistant then “sees” 6 incoming sensors, which are being logged on the system, where the data can be put into graphs and monitored over time. The 6 sensors in this case are both Xiaomi devices (“Livingroom” and “Bathroom”) which both monitor three values each; temperature, humidity, battery level. This screen grab was taken from my Home Assistant homepage:

The Home Assistant is clever enough to analyse your network at start-up and see if other devices are connected on your home network that it can use. I discovered and added my Philips Hue lights, so that they can be turned on and off from the dashboard, as well as triggered by other events.
I also discovered my home energy monitoring system, an Engage Efergy Hub, can also be picked up by Home Assistant. With some more tinkering, I was able to include my realtime energy usage, overall energy consumed since the beginning of the year, and a daily energy cost:

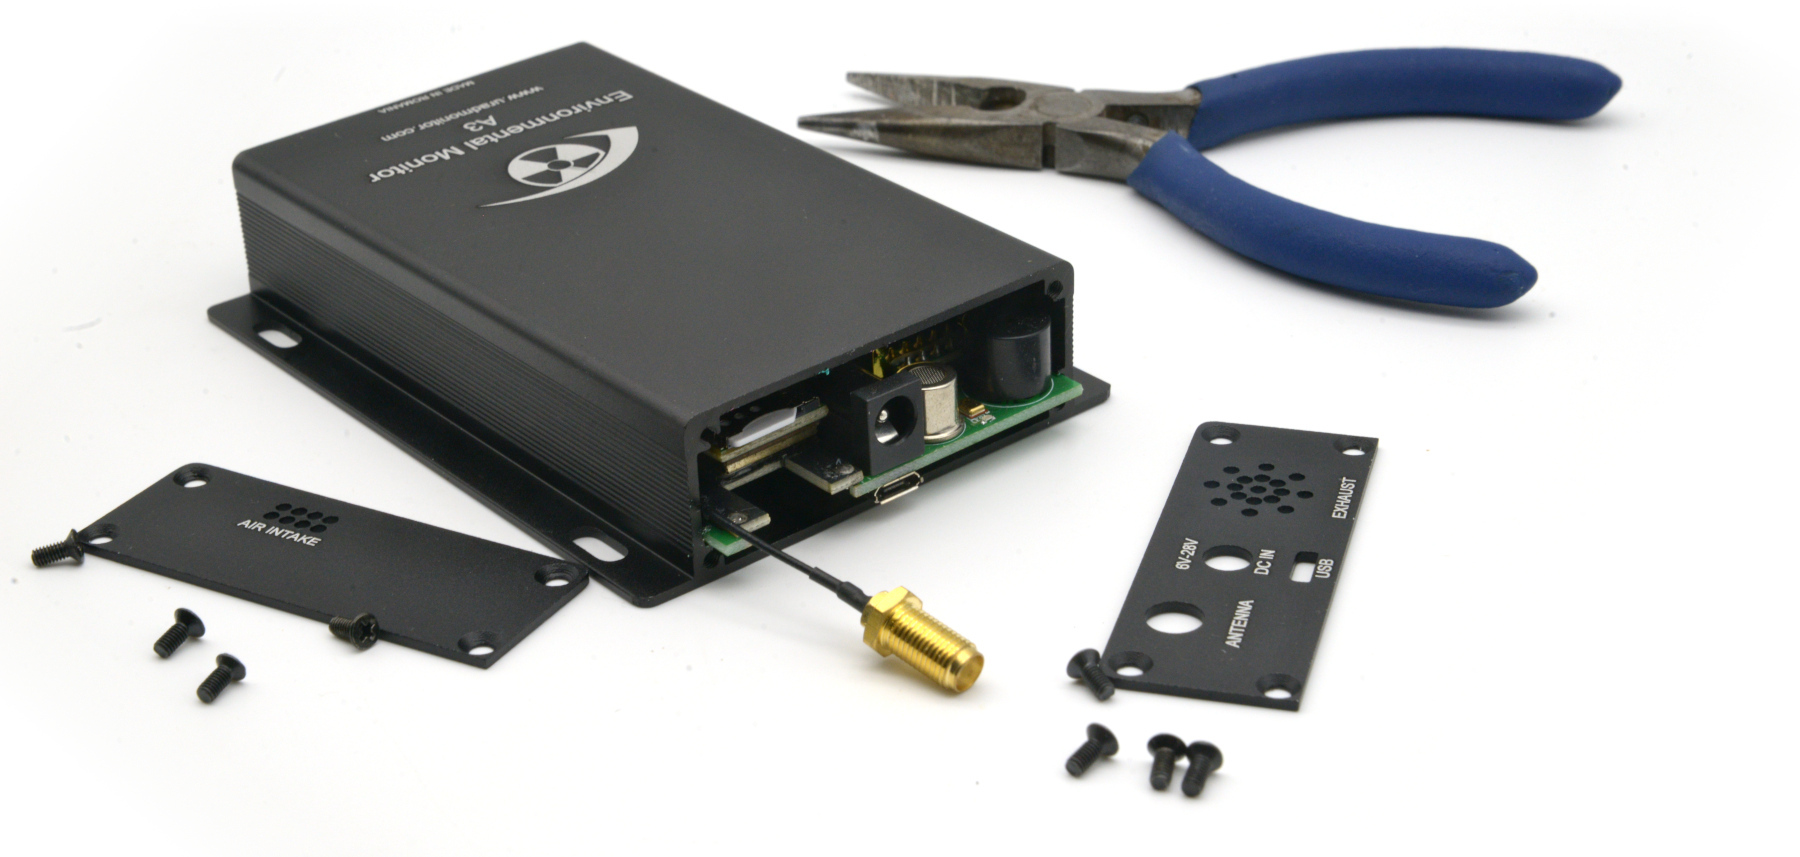
Whilst reading online posts about Home Assistant, it became apparent that many other sensors can be added, or additional data could be imported from elsewhere. That’s when my uRADmonitor popped into my mind. If I use an internet browser and look at my local uRAD Model 3 monitor, it outputs it’s sensor data in JSON format. This data can be separated out and imported into Home Assistant as separate sensor readings. So this is exactly what I did:

For those interested in adding your uRADmonitor to your Home Assistant, this is what I did:
Firstly, I identified the IP address of my uRADmonitor by looking at what devices were attached to my home router. Let’s take “192.168.1.15” as an example. I then accessed the Home Assistant files by enabling the “SAMBA add-on” from within Home Assistant, and accessing the “/config/configuration.yaml” file via my computer. The JSON data for the uRADmonitor is located via the ip address, but also include “/j”, as in the below example. In other words, you’d type into the address bar “192.168.1.15/j”.
Inside the configuration.yaml file, I added the following text to the bottom of the file:
sensor:
  - platform: rest
    resource: 192.168.1.15/j
    name: Outside Temperature
    value_template: '{{ value_json.data.temperature }}'
    unit_of_measurement: "°C"

  - platform: rest
    resource: 192.168.1.15/j
    name: Outside Humidity
    value_template: '{{ value_json.data.humidity }}'
    unit_of_measurement: "%"
In the above example, the “sensor:” line indicates the start of a series of additional sensors for Home Assistant to look for. It is only required once, and all additionally added sensors follow the same format each time. Additional parameters can be added, but these are all that I decided to use for the uRADmonitor. The “platform: rest” indicates a sensor, and Home Assistant identifies it as a RESTful sensor. The “name:” tag simply tells Home Assistant what you want this sensor to be identified as. Then, “resource: 192.168.1.15/j” tells the sensor where to look for the data. The “value_template:” tells the Home Assistant what value from the JSON you want to use. Every sensor entry in the config will have “value_json.data.” in them. The only things that change for each entry are the next word. In the above example I added “temperature”, in order to pull the temperature data from the JSON file. The “unit_of_measurement:” tells Home Assistant what unit to assign when it displays the data.
There was some programming tinkering that took me a while to figure out. The sensor data for “Pressure” is a six-figure result directly from the Model 3. For example, as in the above image, the raw JSON data was “101777”. I had to figure out a way to add a decimal point in the correct place, in order for the data to be logged correctly as “1017.77”. The same issue came from the Radiation reading. The raw JSON data was “15” but the correct logging figure needed to be “0.15”. This was done by adding maths formulas within the sensor set-up.
To add the decimal point for “pressure”, I changed the line:
to
And to put a zero and full stop before the “radiation:” reading, I changed the line:
to
The software is quite powerful and allows additional features such as “zones”, and “automation”, For example, I have set up my home address as a zone, and I can set an automated rule that turns all the lights off if I leave that zone, but only after sunset. I have also set a similar automation rule that will turn on a specific light if I enter the home zone, but only if the sun has already set. By using the Home Assistant iOS App, I am also able to track the mobile phone on a map, and use it’s location to trigger events.
Overall I am pleased with the two days work I have spent tinkering with the Home Assistant software and the ESP32. I now have an operating Home Assistant that I can access from anywhere in the world, and monitor my current sensors.
The next step is to figure out a way to include my Teckin wifi enabled plugs, so they can be turned on and off via the homepage, and include their “per plug” energy monitoring data on my dashboard.
UPDATE: The Teckin plugs were a little trickier to integrate. A specific model contains the circuitry that includes power monitoring in the plug itself. If you are buying these, look out for the square “Teckin SP23” model. It should also specify “power monitoring” in the description. DO NOT get the SP27, round plugs. They will NOT work. Also, I’m not to blame if you do anything wrong here…
Newer versions (V1.0.5 and above) contain a newer firmware which made it more difficult to “hack”. Two GitHub users have solved this problem, using their code which they call “tuya-convert”. One version does original old firmware, out of the box. There’s no wiring or opening up of the device required. It’s all done over-the-air via a faked software update. Another version does the newer plugs which have the “protected” firmware on it. Again, no opening up of the product is required. Simply flash it over the air.
I say simply… To flash the Teckin SP23‘s you need a Raspberry Pi to run the code that’s been written, a device to connect to a fake wifi hotspot, and physical access to each plug you want to flash.
One tip here. There is a function called “tail” which allows you to see when new information is written to a log file, by reading and updating the file in realtime in a window. There is a folder called “scripts” that comes with the tuya-convert software. Use the tail function to monitor the logs for the wifi connection and the web update file. You will be able to see when devices connect and talk to each other, as these log files will update each time. It’s a handy way to see if the plug is actually doing any updates…
So, basically, when you run the tuya-convert software ( ./start-flash.sh) there are a few steps to go through. Firstly, the software makes you type in “YES” to agree that they are not to blame if you break anything. After that step, it enables a wifi hotspot via the Raspberry Pi and tells you to connect a device (I used my phone) to this new hotspot, which is called something like “v-trust”. The password for the hotspot is “flashmeifyoucan”.
With the phone connected, you then press and hold the power button on the Teckin SP23 plug for around 6 seconds. This resets the plug and puts it into search/update mode. If you have used the tip above about the “tail” command, you will see an update on the wifi log that a phone has connected, and it’ll show the MAC address of the device. If you don’t use the tail command, everything will still update, but you kinda feel like you’re in the dark and there’s not much else showing you that its doing anything.
With the plug waiting for an update, the server operational, and the phone connected as the fake authentication, you can now execute the next step. Press enter.
Firstly the plug will connect to the hotspot and handshake with your phone (and you’ll see the plug MAC address in the log file), to “get the okay” that it’s safe to do an update. Once they’re all talking to each other, you’ll hear the plug relay click, and the blue light will stop flashing. The raspberry pi software will then change to show it’s downloading the latest generic firmware (and, using the tail command, you’ll see data appear in the web log). Once that’s done, there’s two more scripts to run. The first tells the plug that you are confirming or denying an update. If you deny, it will put the original firmware back on the plug and it’ll return to normal like nothing happened. It’s called “flash2” in the documentation.
Once “flash2” has been executed, you need to execute “flash3”. This puts the newly downloaded default generic firmware onto the Teckin SP23 plug. It only takes a few seconds, but be patient. Within a minute or so, if you look for new wifi networks nearby, you’ll notice a new wifi device called “sonof-xxxx”. The x’s will be a random sequence of 4 numbers. For example “sonof-2641”. You can now directly connect to your plug via wifi, and flash it with any firmware you like, or connect it to your router.
I followed Quindor’s video and used ESPHome on Home Assistant to create firmwares for each plug. I also followed his procedure for calibration, which required each plug to connect to a device with a known power usage. In my case, a 40w fan. I had to tweak a couple of numbers in the code and monitor the output of the plug til the values matched.
tuya-convert for original older Teckin SP23 plugs pre v1.0.7 firmware
tuya-convert for newer Teckin SP23 plugs, post Oct 2019, v1.0.7 firmware
I will be glad to hear more about the sensor for getting data from the json and maybe see that added into HomeAssistant 🙂
I have added some more information to the post, including what code I added to the configuration file and also the adjusted code I tweaked to round figures up and add decimal points. I will continue to re-write some of the post with additional information as I go along.
I’m more thank thankful for that.
Thanks for the pointers! Helped me produce an integration a uRADMonitor MODEL A3 in to HA
————–Entities Card Configuration—————-
type: entities
entities:
– entity: sensor.urad_wsb_temperature
secondary_info: last-updated
name: Temperature C
icon: mdi:temperature-celsius
– entity: sensor.urad_wsb_temperaturef
secondary_info: last-updated
icon: mdi:temperature-fahrenheit
name: Temperature
– entity: sensor.urad_wsb_humidity
icon: mdi:air-filter
name: Humidity
secondary_info: last-updated
– entity: sensor.urad_wsb_pressure
secondary_info: last-updated
icon: mdi:gauge
name: Pressure
– entity: sensor.urad_wsb_carbondioxide
name: co2 CarbonDioxide
icon: mdi:molecule-co2
secondary_info: last-updated
– entity: sensor.urad_wsb_voc
name: VOC
icon: mdi:gas-cylinder
– entity: sensor.urad_wsb_formaldehyde
name: ch2o Formaldehyde
icon: mdi:gas-cylinder
secondary_info: last-updated
– entity: sensor.urad_wsb_noise
name: dB Noise
secondary_info: last-changed
– entity: sensor.urad_wsb_ozone
secondary_info: last-changed
name: o3 Ozone
icon: mdi:gas-cylinder
– entity: sensor.urad_wsb_pm1_0
name: PM 1.0
icon: mdi:air-filter
secondary_info: last-changed
– entity: sensor.urad_wsb_pm2_5
icon: mdi:air-filter
name: PM2.5
secondary_info: last-updated
– entity: sensor.urad_wsb_pm10
name: PM10
icon: mdi:air-filter
secondary_info: last-updated
state_color: false
show_header_toggle: true
————–/config/configuration.yaml—————-
sensor:
– platform: rest
resource: http://192.168.3.89:667/j
name: uRAD WSB TemperatureF
value_template: ‘{{ (((value_json.data.temperature) | float * 9/5) + 32)|round(2) }}’
unit_of_measurement: “°F”
– platform: rest
resource: http://192.168.3.89:667/j
name: uRAD WSB Temperature
value_template: ‘{{ value_json.data.temperature }}’
unit_of_measurement: “°C”
– platform: rest
resource: http://192.168.3.89:667/j
name: uRAD WSB Pressure
value_template: ‘{{ ((value_json.data.pressure |float-0)/1000*10)|round(2) }}’
unit_of_measurement: “Pa”
– platform: rest
resource: http://192.168.3.89:667/j
name: uRAD WSB Humidity
value_template: ‘{{ value_json.data.humidity }}’
unit_of_measurement: “RH”
– platform: rest
resource: http://192.168.3.89:667/j
name: uRAD WSB VOC
value_template: ‘{{ ((value_json.data.voc |float-0)/1000*10)|round(2) }}’
unit_of_measurement: “KO”
– platform: rest
resource: http://192.168.3.89:667/j
name: uRAD WSB CarbonDioxide
value_template: ‘{{ ((value_json.data.co2 |float-0)/1000*10)|round(2) }}’
unit_of_measurement: “ppm”
– platform: rest
resource: http://192.168.3.89:667/j
name: uRAD WSB Ozone
value_template: ‘{{ value_json.data.o3 }}’
unit_of_measurement: “ppm”
– platform: rest
resource: http://192.168.3.89:667/j
name: uRAD WSB Formaldehyde
value_template: ‘{{ value_json.data.ch2o }}’
unit_of_measurement: “ppm”
– platform: rest
resource: http://192.168.3.89:667/j
name: uRAD WSB PM1.0
value_template: ‘{{ value_json.data.pm1 }}’
unit_of_measurement: “ug/m^3”
– platform: rest
resource: http://192.168.3.89:667/j
name: uRAD WSB PM2.5
value_template: ‘{{ value_json.data.pm25 }}’
unit_of_measurement: “ug/m^3”
– platform: rest
resource: http://192.168.3.89:667/j
name: uRAD WSB PM10
value_template: ‘{{ value_json.data.pm10 }}’
unit_of_measurement: “ug/m^3”
– platform: rest
resource: http://192.168.3.89:667/j
name: uRAD WSB Noise
value_template: ‘{{ value_json.data.noise }}’
unit_of_measurement: “dB”
Very nice!
Any luck adding uradmonitor as a sensor into HomeAssistant natively (instead of manual YAML configuration)?