
- This topic has 4 replies, 3 voices, and was last updated 7 years, 5 months ago by
.
Viewing 5 posts - 1 through 5 (of 5 total)
Viewing 5 posts - 1 through 5 (of 5 total)
- You must be logged in to reply to this topic.
uRADMonitor. harry.rikken
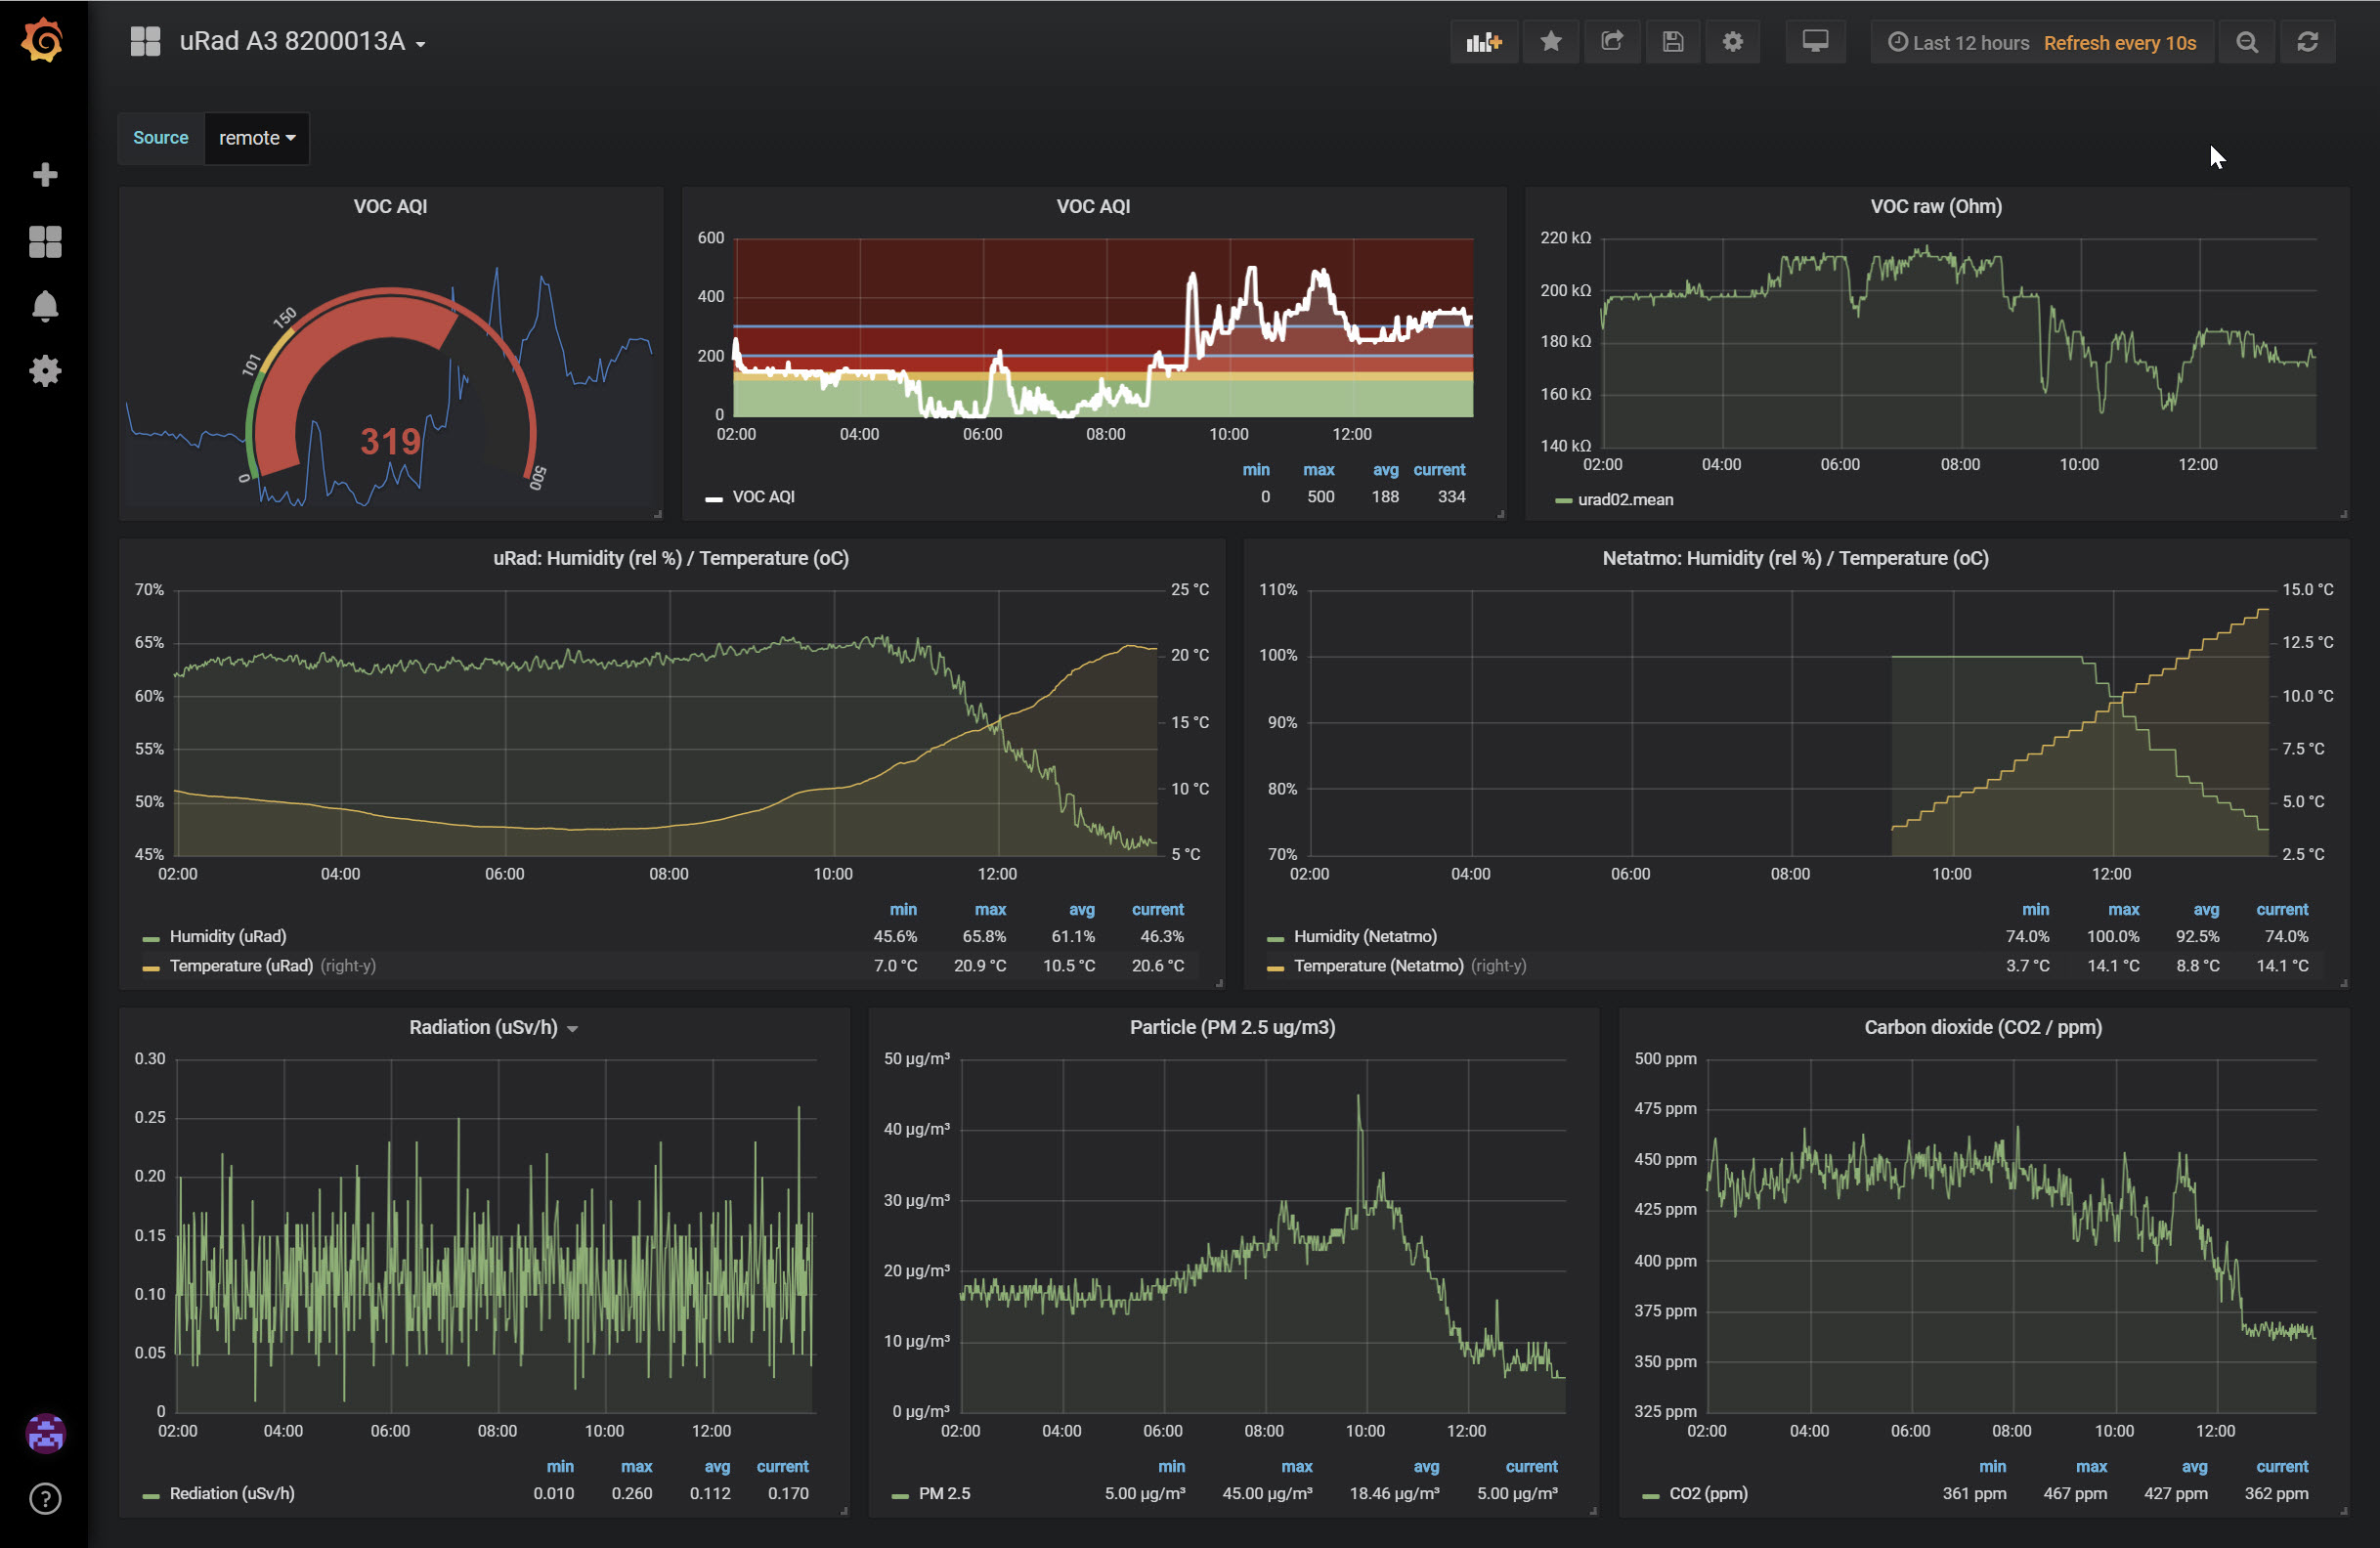
Maybe some of you are interested: how to collect the uRad A3 data, store them in a time series database and monitor the metrics.
The components to use are:
– NodeRed to wire up the REST API of uRad with the database
– InfluxDB to store and retrieve the data with high performance
– Grafana to present the data in nice graphics and monitor with anomaly detection
In the end, it looks something like the screenshot I’ve added to this post.
If you’re interested, give me a call.
 Stratos Zolotas
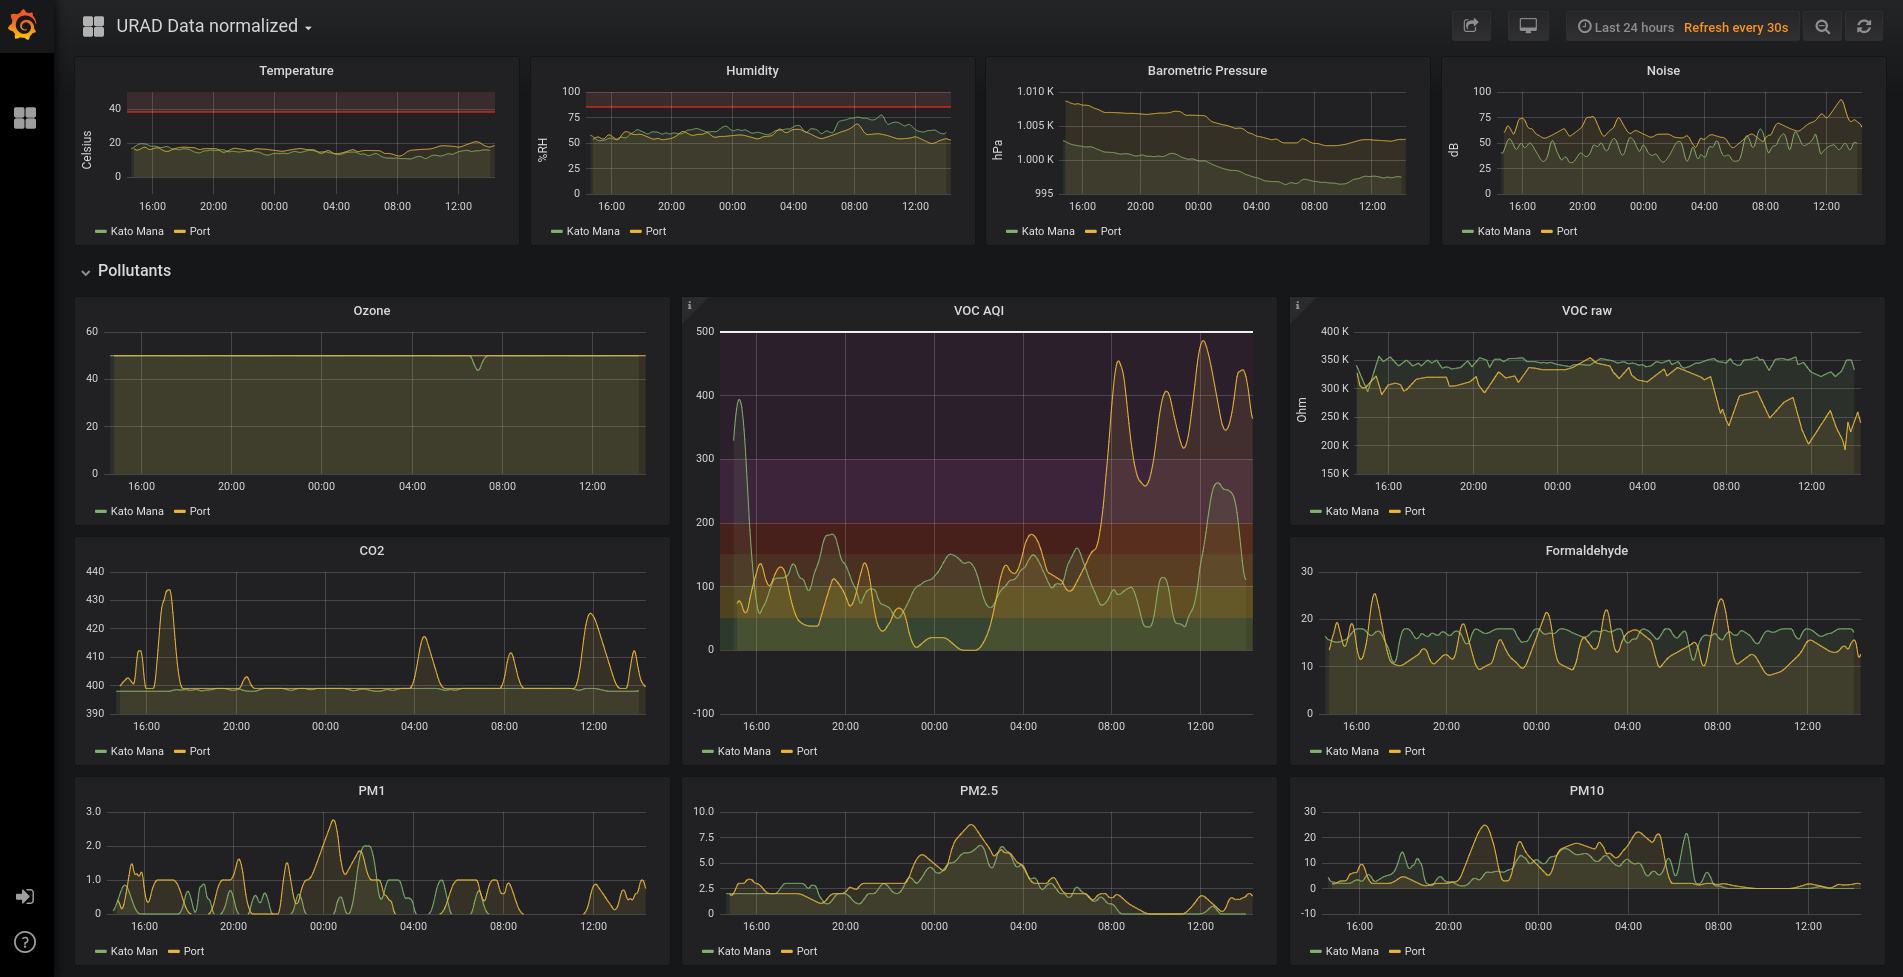
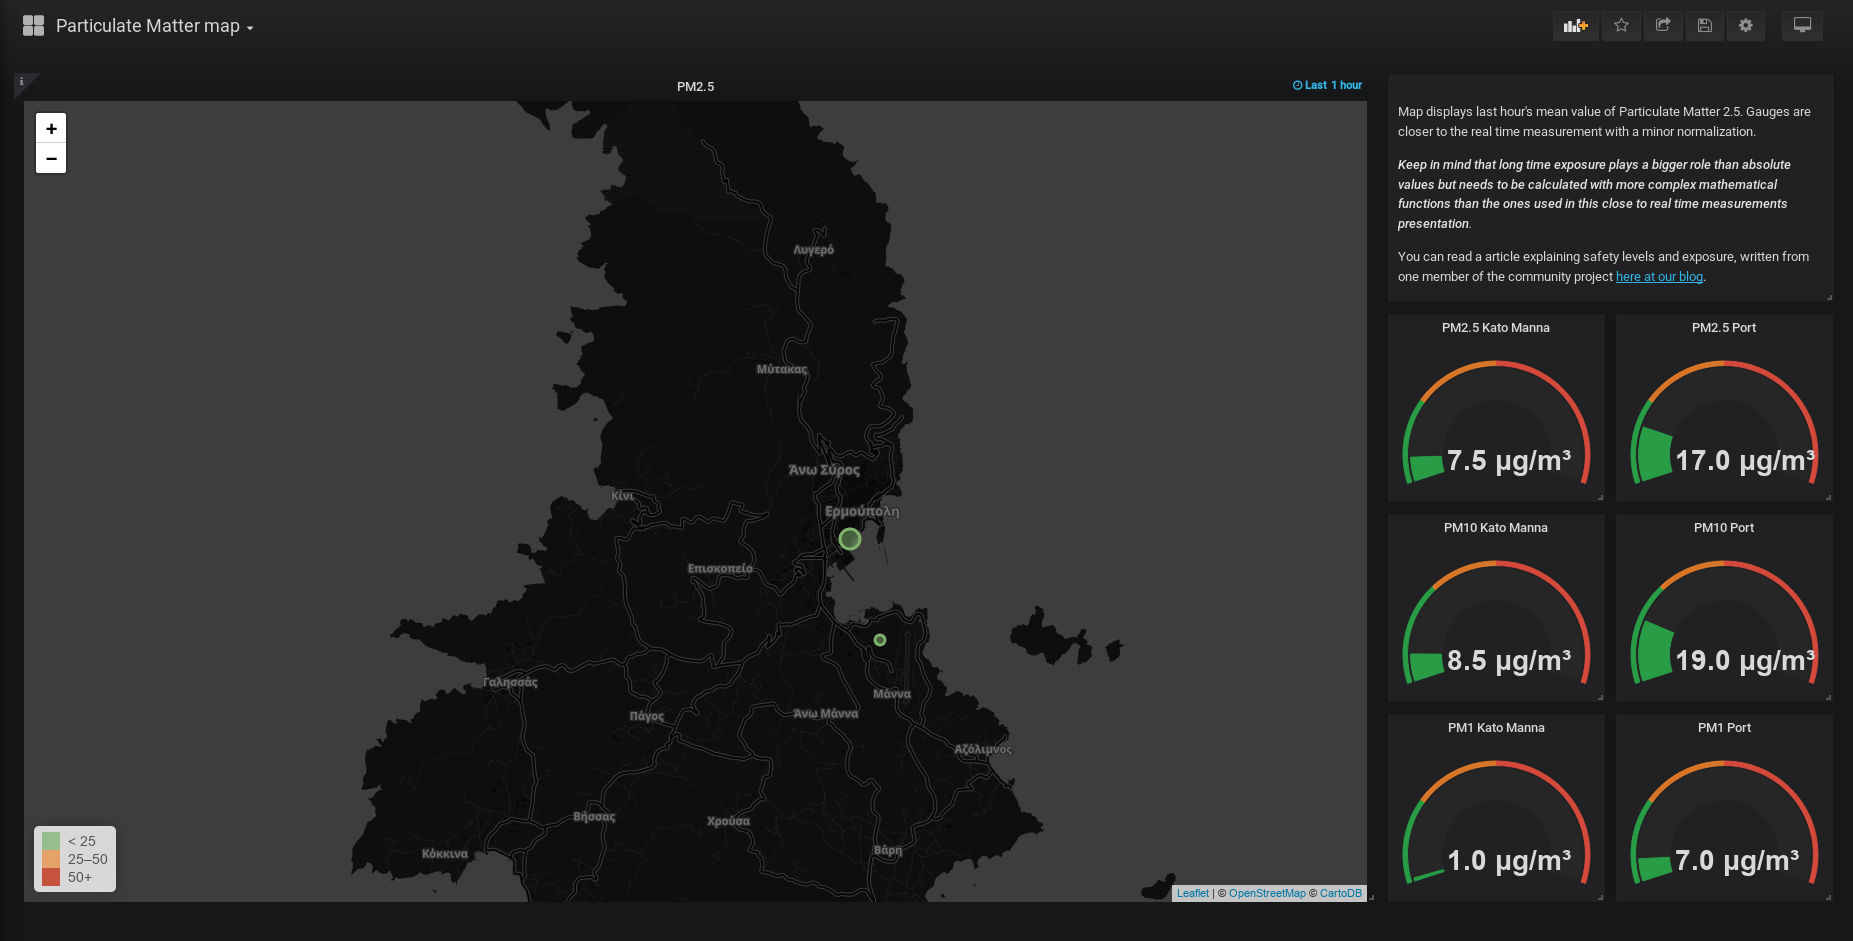
We are doing the same also for our community network in Syros, Greece and also professionally for others.
The pic is from our community monitoring server. We also use Chronograf and Kapacitor for realtime alerts to a Telegram announcement channel. I was supposed to write a small blog post with basic instructions but haven’t found the time to do it (my fault)…
 uRADMonitor
@baskin, it is never too late! Looks good!
Stratos ZolotasYeah I know… still haven’t but not lazy 😉
uRADMonitorYes, time’s always an issue. Would you like to start the post now? Seems like you have some interesting things to share with the community!