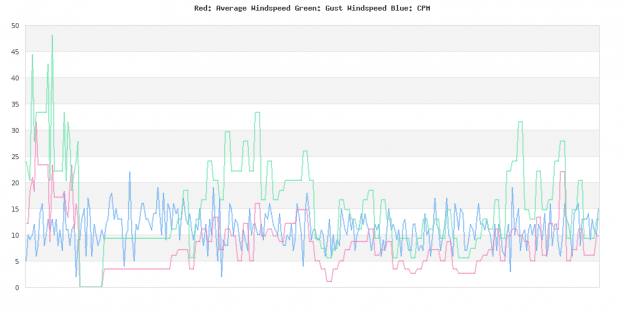
I’ve been running uRAD unit #12000003 here in Australia for around 12 months now and the only time I’ve really seen a solid increase in readings is during heavy rain which got me thinking, what other weather conditions affect radiation levels?
To find out I purchased a cheap weather station off eBay and set about mounting and configuring it.
I mounted the unit on the roof high enough so that it shouldn’t be affected by surrounding houses or two much radiant heat from the tin roof.

Mounted on the roof

Display unit mounted in the lounge room
The unit comes with USB out which is connected back to a Windows 7 computer running Weather Display which includes the ability to write to a MySQL database as well as upload to various weather sites around the world.
I have mine configured to write to a MySQL database on my web server every 5 minutes.


To be able to compare these to readings from the uRAD Monitor I wrote a small python script which is on my web server and uses the JSON facility on the unit.
Below is how the data looks when inserted to the MySQL table.

uRAD MySQL table
The JSON python script and php files for generating the below graphs can be downloaded here. (Username, password and database name will need to be set)
Each graph is a 24 hour period or 288 data points @ 5 minute intervals.


I plan on adding a number of extra sensors (MQ-9, BMP180, DHT22, ML8511) directly next to the uRAD monitor in the near future to allow further data collation and a better overall view of current air quality conditions, once I have found a project box to mount it in I will put together a post with details and code.

codemore code
~~~~