Radu Motisan has a dream to give the world a view on what is happening in your surrounding environment and how this could influence your health.
In my own professional life, I’m involved as a consultant in IOT data gathering and processing and I design and deploy solutions for organizations with whom I share that mutual interest: from the sensor to the analytics.
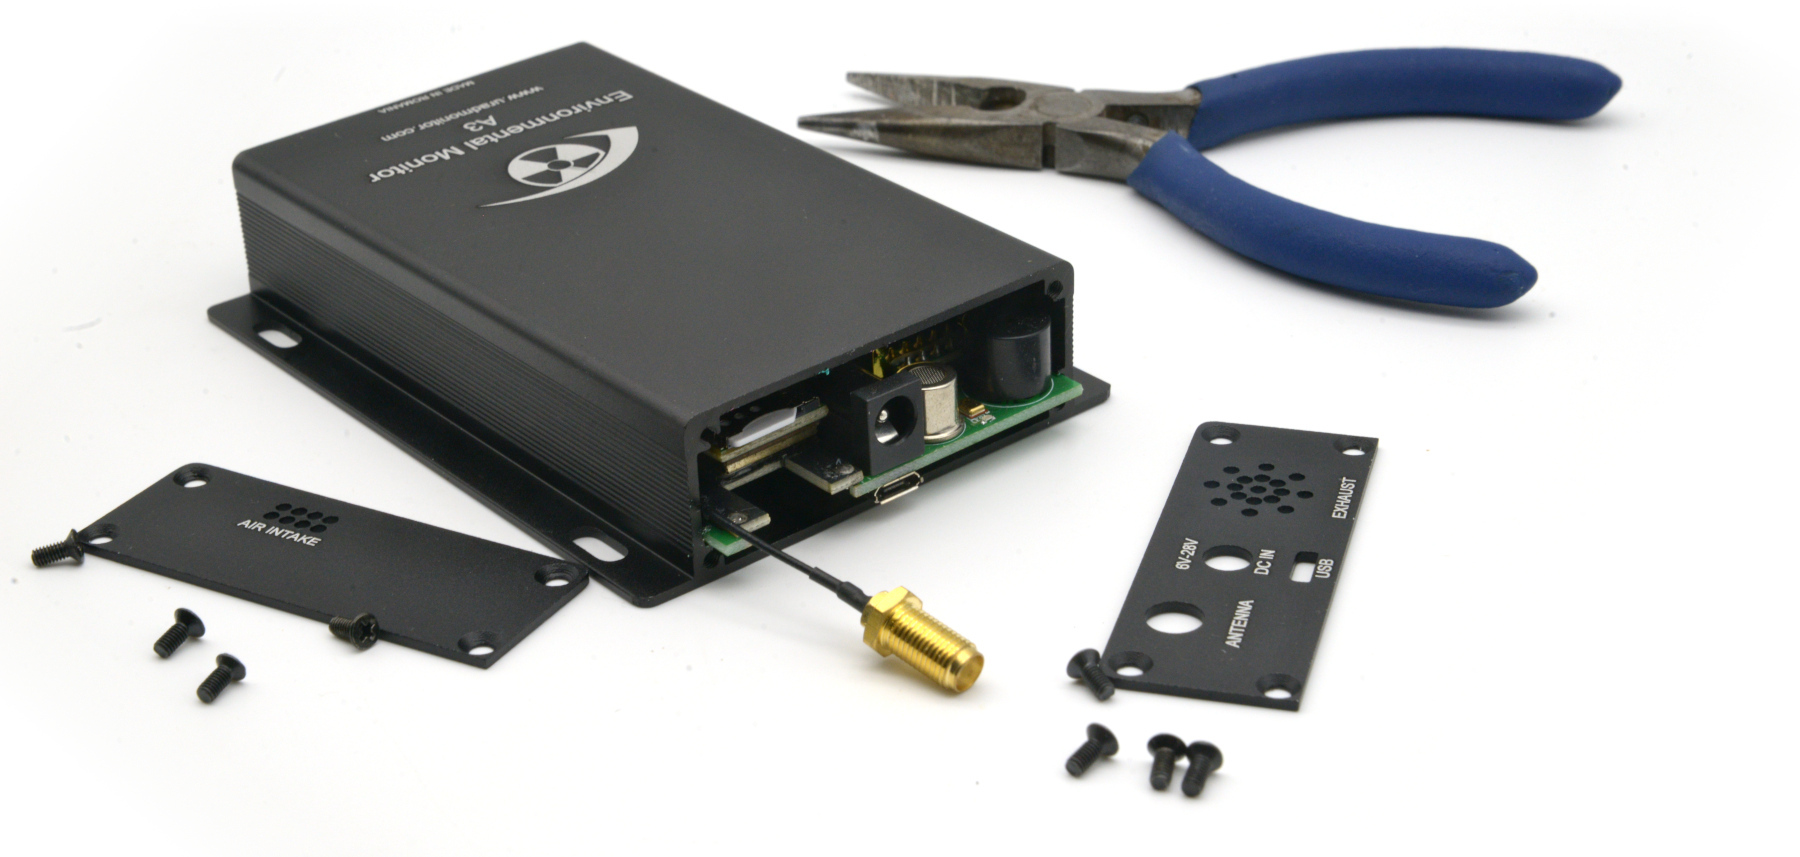
Since I’m also interested in the same data as Radu, I recently acquired the marvelous uRAD Monitor A3. I installed it in my garden and watched the metrics coming in.
Next to that I spend a lot of time on home automation especially weather monitoring and hence climate control.
In order to do something with my locally gathered data, I decided to integrate the uRad metrics into my home automation project.
Hence I did so.
As soon as I finished that job I posted an image and a teaser in the uRad forum and before I knew it, requests came in to post a blog about the subject: it seems that a lot of you are interested!
And here it is my friends: the Domoticz blog.
I would like to encourage you all to make a step forward into the world of IOT because this will be a main topic the coming years.
When you start your own project I hope you’re going to share your endeavors with us as well.
Introduction
In order to present your uRad data in a domotics appliance, 4 steps have to be taken:
- Acquire the data and transform them into metrics
- Do some post-processing of the metrics
- Push the metrics to the domotics appliance
- Present the metrics in a comprehensible fashion
To accomplish these steps you’ll need a bit of computing power and software that can process and display the data.
Don’t get fooled here: you don’t need a mainframe to do that because a simple RaspberryPi will do more than that!
In the next chapter, I’ll give you more details about the setup.
Prerequisites
As I said you’ll need a computer and software.
First of all, you’ll need a computer system with an OS to install the software on.
Here you can choose out of many options:
- PC
- Virtual machine (VMWare, Virtualbox, etc)
- Docker container
- Single board computer like the well known and supported Raspberry Pi (https://www.raspberrypi.org/) or a more powerful board like the UDOO x86 (https://www.udoo.org/udoo-x86/)
In this tutorial I’ll stick to the Raspberry PI because it’s cheap, has more than enough computing power and the support is overwhelmingly good.
Although the solution I present will run on many OS-flavours (Linux, Windows, Mac-OS), the OS we’re going to use here is standard Raspbian, a fork of Debian but tailormade for the Raspberry Pi.
The basic hardware you need is a Raspberry Pi with a decent SD Card of 16 Gb. That is enough.
I presume you have a PC or Laptop and access to your local area network
The software you’ll need is:
- Raspbian OS
- Node-Red
- Domoticz
Installation of the essentials
Per component I’ll give you either the directions where you can find the instructions or a detailed explanation of what to do.
The Raspberry PI basic setup
I assume you possess enough knowledge to get the Raspberry PI up and running. You can find detailed instructions on https://www.raspberrypi.org/documentation
When the RPI is powered on and connected to the network, please make sure to write down its IP address because you’ll need that later on.
When finished get access to the RPI via SSH. For Windows machines, you can use WinSCP in combination with Putty for that.
Again, I assume you have some knowledge of Linux and a basic command line skills (you don’t need to be an expert).
The domotics application
The boys and girls form Domoticz designed a beautiful application for your home automation project.
This is where the data ends up and where it is presented to you.
It can be installed easily. Follow the instructions at https://www.domoticz.com/wiki/Raspberry_Pi
This tutorial also contains the instructions on how to set up the Raspberry PI.
When everything goes well you can open the Domoticz application at http://<the-ip-of-the-rpi>:8080
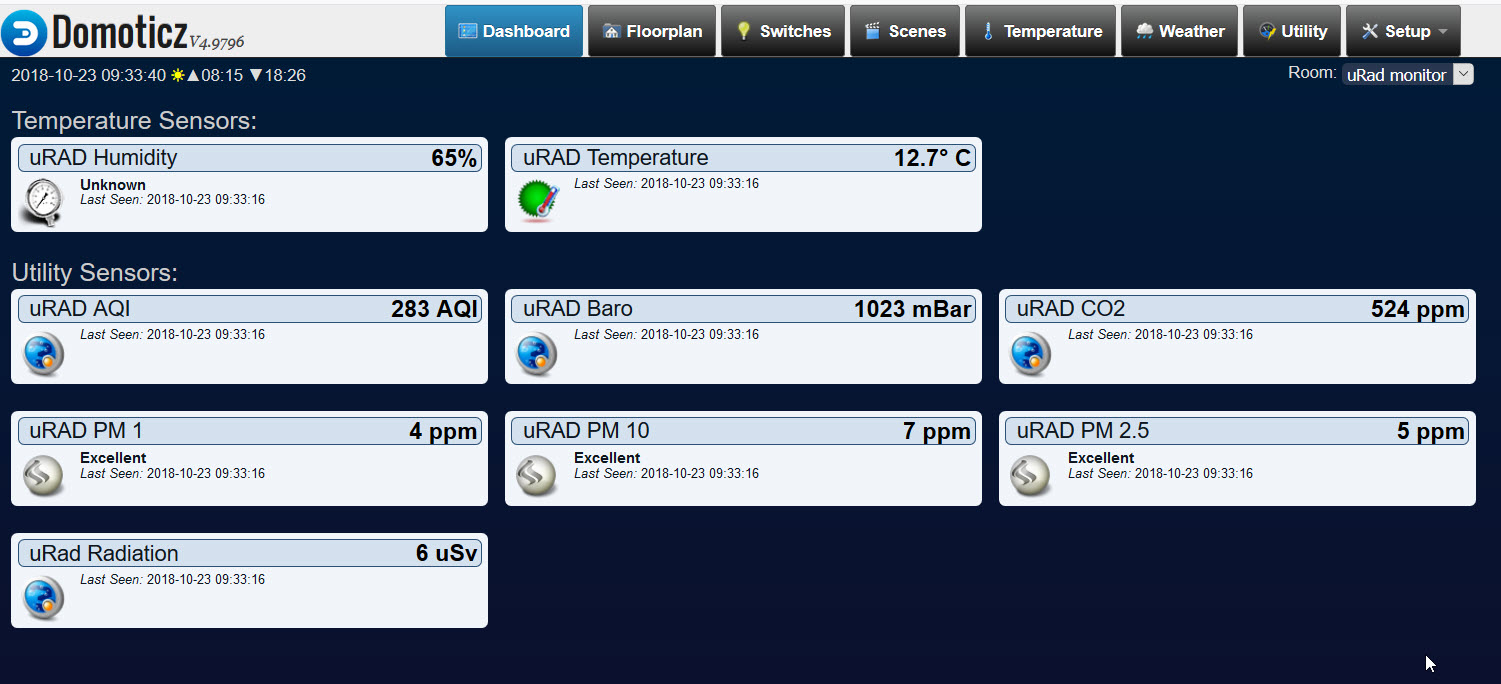
Please exercise a bit to get acquainted with Domoticz before you proceed.
You’ll see a webpage similar like this:

Figure 1.
Node-Red
Node-Red (https://nodered.org/) is the glue between network connected machines and sensors. It is invented by IBM and nowadays freely available for use.
Node-Red is very well maintained and suitable for 7 x 24-hour usage like the RaspberryPI is.
Node-Red is needed to acquire the data from the local uRad monitor, post-process is and forward it to your Domoticz application.
The installation of Node-Red is very well explained at https://nodered.org/docs/hardware/raspberrypi
When everything goes well you can open the Noed-Red application at http://<the-ip-of-the-rpi>:1880
Please exercise a bit to get acquainted with Node-Red before you proceed.
You’ll see a webpage similar like this:

Figure 2.
Ok friends, that’s it as to the prerequisites!
Welll done.
Getting the data in and present them in Domoticz
In order to see the metrics in Domoticz the following steps need to be taken:
Define the devices in Domoticz.
Typically these devices will contain all metrics that are provided by the uRadmonitor; temperature, humidity, AQI, CO2, radiation, PM1, 10 and 2.5, Pressure.
These are all so-called ‘virtual sensors’ in Domoticz.
- Create one dummy in the hardware tab: https://www.domoticz.com/wiki/Hardware_Setup#Dummy_Hardware
- Create the following virtual sensors (start within Domoticz at the ‘hardware’ tab and click on the ‘Create Virtual Sensor’ button):
- One ‘Temperature’ sensor and one ‘Humidity’ sensor (call them uRad Temp and uRad Hum)
- Three ‘Air Quality’ sensors (call them uRad PM 1, uRad PM 10 and uRad PM 2.5)
- Four ‘Custom sensors’ (call them uRad CO2 <units ppm>, uRad Radiation <units uSv>, uRad AQI and uRad Baro <units mBar>).
- Click on the Devices tab and write down the IDX numbers of the nine virtual sensors you’ve just created; you’ll need those numbers later on.
So far, so good. You’re done with Domoticz for now.
Create the data flows in Node-Red
Now comes the magic: Node-Red.
You’ll have to gather the data reformat it so Domoitcz can understand it and publish the data in Domoticz.
Since you’re going to grab the data from the web service of uradmonitor.com you’ll have to get the authorization credentials first.
These credentials consist of a user-id and a user-key. Both of them are available at https://www.uradmonitor.com/dashboard/
You’ll need to login first of course. Then go to your dashboard an click on the tab ‘API’. You can find your credentials there and write them down (copy / paste).
Open Node-Red on your RPI at http://<the-ip-of-the-rpi>:1880
Copy (Ctrl-C) the code underneath onto your clipboard.
It’s best to grab the the code at Pastebin: https://pastebin.com/S0Dschs4
Or… select the code below, starting with the bracket (‘[‘). Be aware of the fact that WordPress messes up with special characters while copying and pasting so importing via the clipboard won’t work before you find / replace som special characters like:
[{“id”:”7a63db2d.88c1a4″,”type”:”function”,”z”:”af1e9793.0708c8″,”name”:”Fill request with authentication headers”,”func”:”msg.headers = {};\nmsg.headers[‘X-User-id’] = ‘user-id’;\nmsg.headers[‘X-User-hash’] = ‘user-key’;\n\nreturn msg;”,”outputs”:1,”noerr”:0,”x”:570,”y”:160,”wires”:[[“db05819a.5fc0f”]]},{“id”:”db05819a.5fc0f”,”type”:”http request”,”z”:”af1e9793.0708c8″,”name”:”Call uRad webservice”,”method”:”GET”,”ret”:”obj”,”url”:”https://data.uradmonitor.com/api/v1/devices/<deviceid>/all/60″,”tls”:””,”x”:880,”y”:160,”wires”:[[“e9c031f.11807d”,”4939d325.cdc66c”]]},{“id”:”55d325f0.95c5dc”,”type”:”inject”,”z”:”af1e9793.0708c8″,”name”:”Read remote uRad data”,”topic”:””,”payload”:””,”payloadType”:”date”,”repeat”:””,”crontab”:””,”once”:false,”onceDelay”:0.1,”x”:280,”y”:160,”wires”:[[“7a63db2d.88c1a4”]]},{“id”:”e9c031f.11807d”,”type”:”debug”,”z”:”af1e9793.0708c8″,”name”:””,”active”:false,”tosidebar”:true,”console”:false,”tostatus”:false,”complete”:”false”,”x”:1130,”y”:280,”wires”:[]},{“id”:”4939d325.cdc66c”,”type”:”function”,”z”:”af1e9793.0708c8″,”name”:”Convert data to HTTP request”,”func”:”var telegram = msg.payload[0];\n\nvar msg1 = {};\nvar msg2 = {};\nvar msg3 = {};\nvar msg4 = {};\nvar msg5 = {};\nvar msg6 = {};\nvar msg7 = {};\nvar msg8 = {};\nvar msg9 = {};\n\nvar pressure = parseFloat(telegram.pressure) / 100\npressure = pressure.toFixed(0)\npressurestr = pressure.toString();\n\nmsg1.topic = \”json.htm?type=command¶m=udevice&idx=xxx&nvalue=\” + telegram.pm25 + \”&svalue=\” + telegram.pm25\nmsg2.topic = \”json.htm?type=command¶m=udevice&idx=xxx&nvalue=\” + telegram.vocaqi + \”&svalue=\” + telegram.vocaqi\nmsg3.topic = \”json.htm?type=command¶m=udevice&idx=xxx&nvalue=\” + telegram.co2 + \”&svalue=\” + telegram.co2\nmsg4.topic = \”json.htm?type=command¶m=udevice&idx=xxx&nvalue=\” + telegram.temperature + \”&svalue=\” + telegram.temperature\nmsg5.topic = \”json.htm?type=command¶m=udevice&idx=xxx&nvalue=\” + telegram.humidity + \”&svalue=\” + telegram.humidity\nmsg6.topic = \”json.htm?type=command¶m=udevice&idx=xxx&nvalue=\” + pressurestr + \”&svalue=\” + pressurestr\nmsg7.topic = \”json.htm?type=command¶m=udevice&idx=xxx&nvalue=\” + telegram.cpm + \”&svalue=\” + telegram.cpm\nmsg8.topic = \”json.htm?type=command¶m=udevice&idx=xxx&nvalue=\” + telegram.pm1 + \”&svalue=\” + telegram.pm1\nmsg9.topic = \”json.htm?type=command¶m=udevice&idx=xxx&nvalue=\” + telegram.pm10 + \”&svalue=\” + telegram.pm10\n\n\nreturn [msg1,msg2,msg3,msg4,msg5,msg6,msg7,msg8,msg9];\n\n”,”outputs”:9,”noerr”:0,”x”:1190,”y”:160,”wires”:[[“b16f2afc.101168”],[“b16f2afc.101168”],[“b16f2afc.101168”],[“b16f2afc.101168”],[“b16f2afc.101168”],[“b16f2afc.101168”],[“b16f2afc.101168″,”792e5881.314458”],[“b16f2afc.101168”],[“b16f2afc.101168″]],”outputLabels”:[“PM2.5″,”AQI”,”AQI”,”Temperature”,”Humidity”,”Barometer”,”Radiation”,”PM1″,”PM10″]},{“id”:”792e5881.314458″,”type”:”debug”,”z”:”af1e9793.0708c8″,”name”:””,”active”:false,”tosidebar”:true,”console”:false,”tostatus”:false,”complete”:”topic”,”x”:1500,”y”:280,”wires”:[]},{“id”:”b16f2afc.101168″,”type”:”http request”,”z”:”af1e9793.0708c8″,”name”:”Push data to Domoticz”,”method”:”GET”,”ret”:”txt”,”url”:”http://127.0.0.1:8080/{{{topic}}}”,”tls”:””,”x”:1540,”y”:160,”wires”:[[“792e5881.314458”]]}]
End here the select (include the last bracket {‘]’).
Go to the Node-Red page and paste the code onto the board as follows:

Figure 3.

Figure 4.
When the code is pasted click ‘Import’.
Then the snippets appear as a flow on the board and it should look like this:

Figure 5.
Whoppa…
The only thing there’s left to do is edit the authentication id and key and edit the IDX parameters for the devices in Domoticz:
- Edit the authentication:
- Double click the snippet A
- Edit the user-id and key according to your own credentials
- Click ‘Done’

- Figure 6.
- Edit the IDX values :
- Double click snippet B
- Edit the IDX values according to the Domiticz devices
- Click ‘Done

- Figure 7.
- Edit the DeviceID of your URAD:
- Click on snippet D
- Edit the URL by replacing the tag <deviceid> with the ID of your own device.
- Click ‘Deploy’

- Figure 8.
And you’re ready to go.
Click on C (Figure 5.) to trigger the data-fetch.
When everything is ok the data should appear in Domoticz.
If something is not working then: start debugging and good luck. It’probably some minor glitch in your code or settings.
When you’re happy with it then edit the snippet C (Figure 5.) and let the trigger repeat every 2 minutes or so. Shorter is not very useful because the uRadmonitor pushes data approximately once per minute.
Have fun and don’t give up!
Harry
P.S.: Link to my website https://www.rikkenit.nl
Some quotes in above code prevent the script from importing into Node-Red (Maybe due to the cut&paste process) .
Replacing ″ with ” solved that problem. (If it does not solve the problem try replacing other type of quotes also with “)
To make it really work I have also replaced with my deviceid number in the Call uRad webserver node (“https://data.uradmonitor.com/api/v1/devices//all/60”)
Thank you for the edit, Piet.
The Node-red script won’t import on my end. The Import button is not clickable…
Please edit or put a functioning copy on pastebin?
Hi, I’ve put a link to PasteBin to get the code.
https://pastebin.com/S0Dschs4
It formatted to json, It won’t import either… 🙂
Try again. I’ve put it on a single line. If this doesn’t work either go and replace all the single and double quotation marks with the simple versions. That’ll d it.
Hey! It worked, but I’m getting this now:
node: Convert data to HTTP request
function : (error)
“TypeError: Cannot read property ‘pressure’ of undefined”
Ok. I forgot to mention that de URL to the webservice has to contain a valid DeviceID.
That has to be filled in the url in nippet D in NodeRed.
I’ve updated the text.
By the way: exercise a bit more with NodeRed and get some hands-on experience with Javascript, the debug console and so on otherwise you’ll get into trouble one way or the other.
Hi, did somebody try/did a change to push the data to an influx database and not directly to domoticz?
When I follow this nothing is is changing, I still see the units info tab…
Since you’re going to grab the data from the web service of uradmonitor.com you’ll have to get the authorization credentials first.
These credentials consist of a user-id and a user-key. Both of them are available at https://www.uradmonitor.com/dashboard/
You’ll need to login first of course. Then go to your dashboard an click on the tab ‘API’. You can find your credentials there and write them down (copy / paste).
Pushing directly to InfluxDB is a daily practice for me and can be done quite easily with a bit of JavaScript knowledge. I use it for my own Grafana dashboards and metrics comparison with other sensors. You’ll still need NodeRed however, or another srcipt that converts the MQTT messages into InfluxDB API calls.
A different scenario would be importimg InfluxDB records via the Telegraf (and the MQTT connector) engine of InfluxDB.