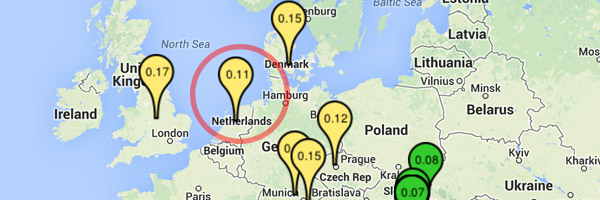
A new unit went online, in a location close to Amsterdam. The new detector is the first in Netherlands, covering more ground as the network expands. The current measurements show a low background radiation level, only 0.09uSv/h.
Here are the initial measurements, performed in Timisoara, Romania, before sending the unit:

And here is the same unit 12000004, running at its destination in Netherlands:

Real time data can be accessed here.
I was wondering why your results are shown in sieverts? Does your Geiger counter have the ability to distinguish between different types of radiation? I am a Nuclear Engineering student graduating in December and I was under the impression that Geiger counters only give the number of counts and say nothing about the type of radiation which can effect the value of equivalent dose implied by using sieverts. Doesn’t this mean that your numbers from dose may be slightly off even if the range of neutrons and alphas are usually very small?
Hi Anthony, you are correct, the Geiger tubes, operating in the Geiger plateau region, record no information on the energy of the incident radiation, instead pulses indicating events. Without knowing the energy, it is impossible to calculate precisely the absorbed dose, but if certain premises are accepted, it can be approximated. Most commercial dosimeters on the market use Geiger tubes and show the absorbed dose, following a similar logic.
The premises include: types of isotopes naturally occurring, responsible for the background radiation level, and cosmic rays, all of relatively known energy levels, and all big enough to place us somewhere above 150keV, where the tube’s response is closer to linear.
But this is only an approximation, to help users scale values to those offered by other dosimeters. It is of minor importance. What’s important is that the uRADMonitor devices only collect radiation data in CPM (counts per minute). The CPM data is sent to the server together with the tube type, and this is the only information stored in the databases regarding the radiation levels.
Here’s a quick example, see:
http://www.pocketmagic.net/uradmonitor/public.php?id=11000005¶m=usvh&start=1&size=large&gmt=America/Phoenix
This will show the chart in uSv/h for the 11000005 unit n Arizona for the last 24h of measurements (because of start=1 that is last day of measurements, start is in days). GMT setting shows the time coordinate in local hour for the Phoenix area.
Now changing param=cpm , will give us the original unaltered data in CPM, as recorded by the detector (type of tube is shown in image):
http://www.pocketmagic.net/uradmonitor/public.php?id=11000005¶m=cpm&start=1&size=large&gmt=America/Phoenix