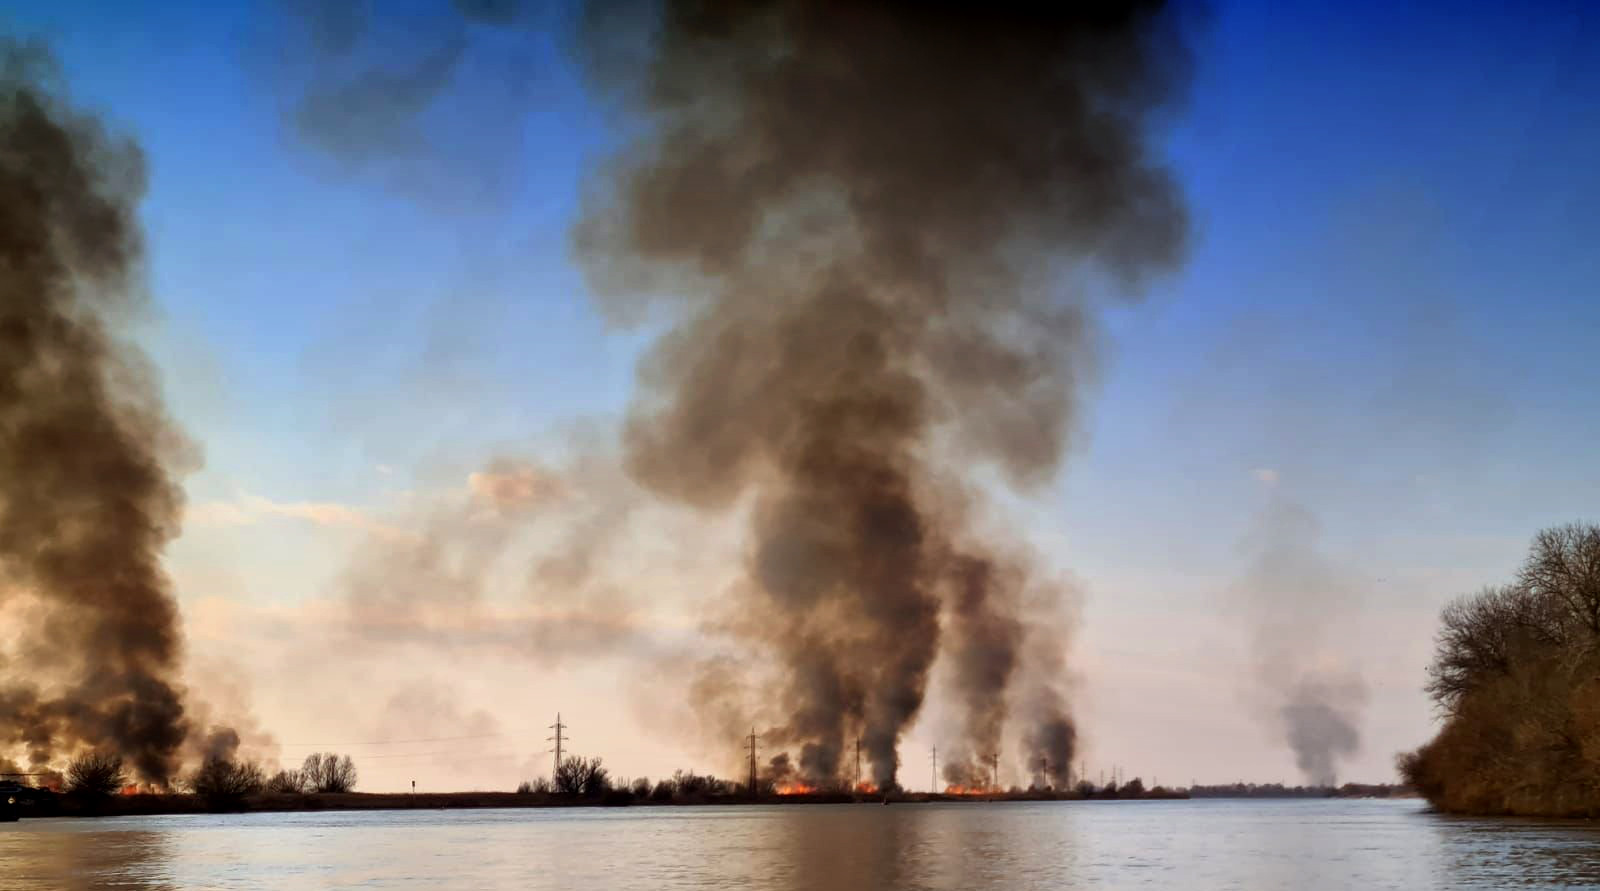
The Ontario wildfires are a serious environmental and health issue that affects many people and communities. According to provincial data, there have been 167 forest fires so far in 2023, which is double the number of fires in the same period in 2022 . The fires have also caused smoke to drift across the province, affecting the air quality and posing a high risk for some people.
As of June 7th afternoon, the Canadian Ministry of Natural Resources and Forestry said there were 54 active fires, with 29 labelled as “not under control”. Some of the fires of note are Wawa 3, which has burned over 6,600 hectares, Cochrane 6 and Cochrane 7, which have burned over 4,000 hectares each, and Pembroke 1, which is located in the Centennial Lake area (source). The province has imposed a Restricted Fire Zone for much of Ontario, which prohibits open air burning within the area to cope at least in part with the huge smoke emissions.
The follow-up
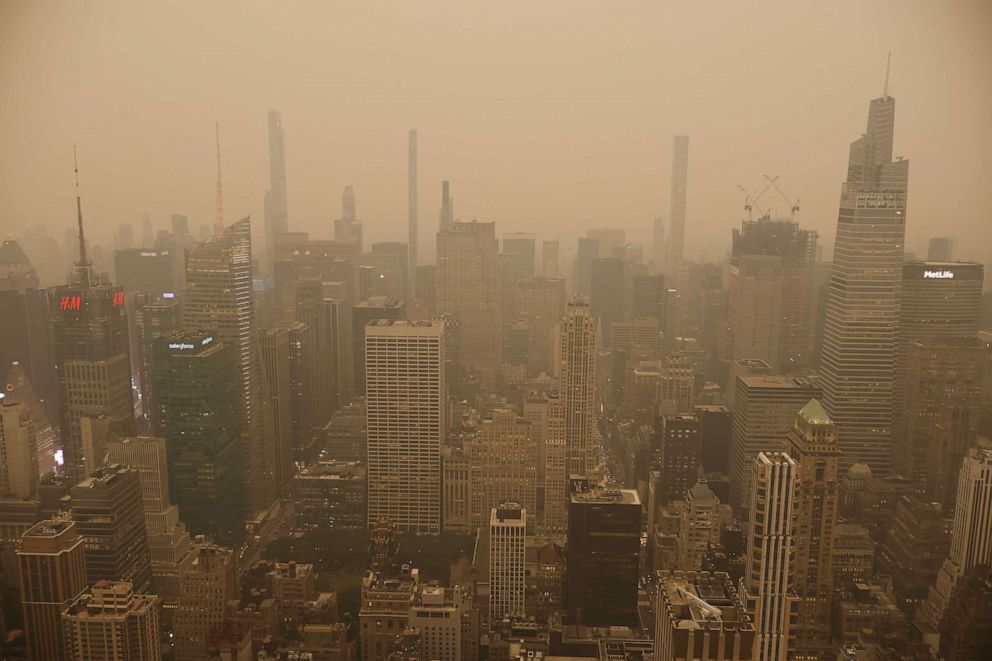
Millions of people in the Midwest and Northeast, from Toronto and New York City to Washington, D.C., faced polluted air throughout the day on June 6 and 7. As wildfire smoke from the wildfires directed south, the New York skyline was barely visible for most of the day, and the smell of the smoke became strong.
Sensor response
Multiple networks of airquality sensors deployed in the affected areas recorded the phenomenon and elevated levels of particulate matter that can pose a health risk especially to the vulnerable categories of the population.
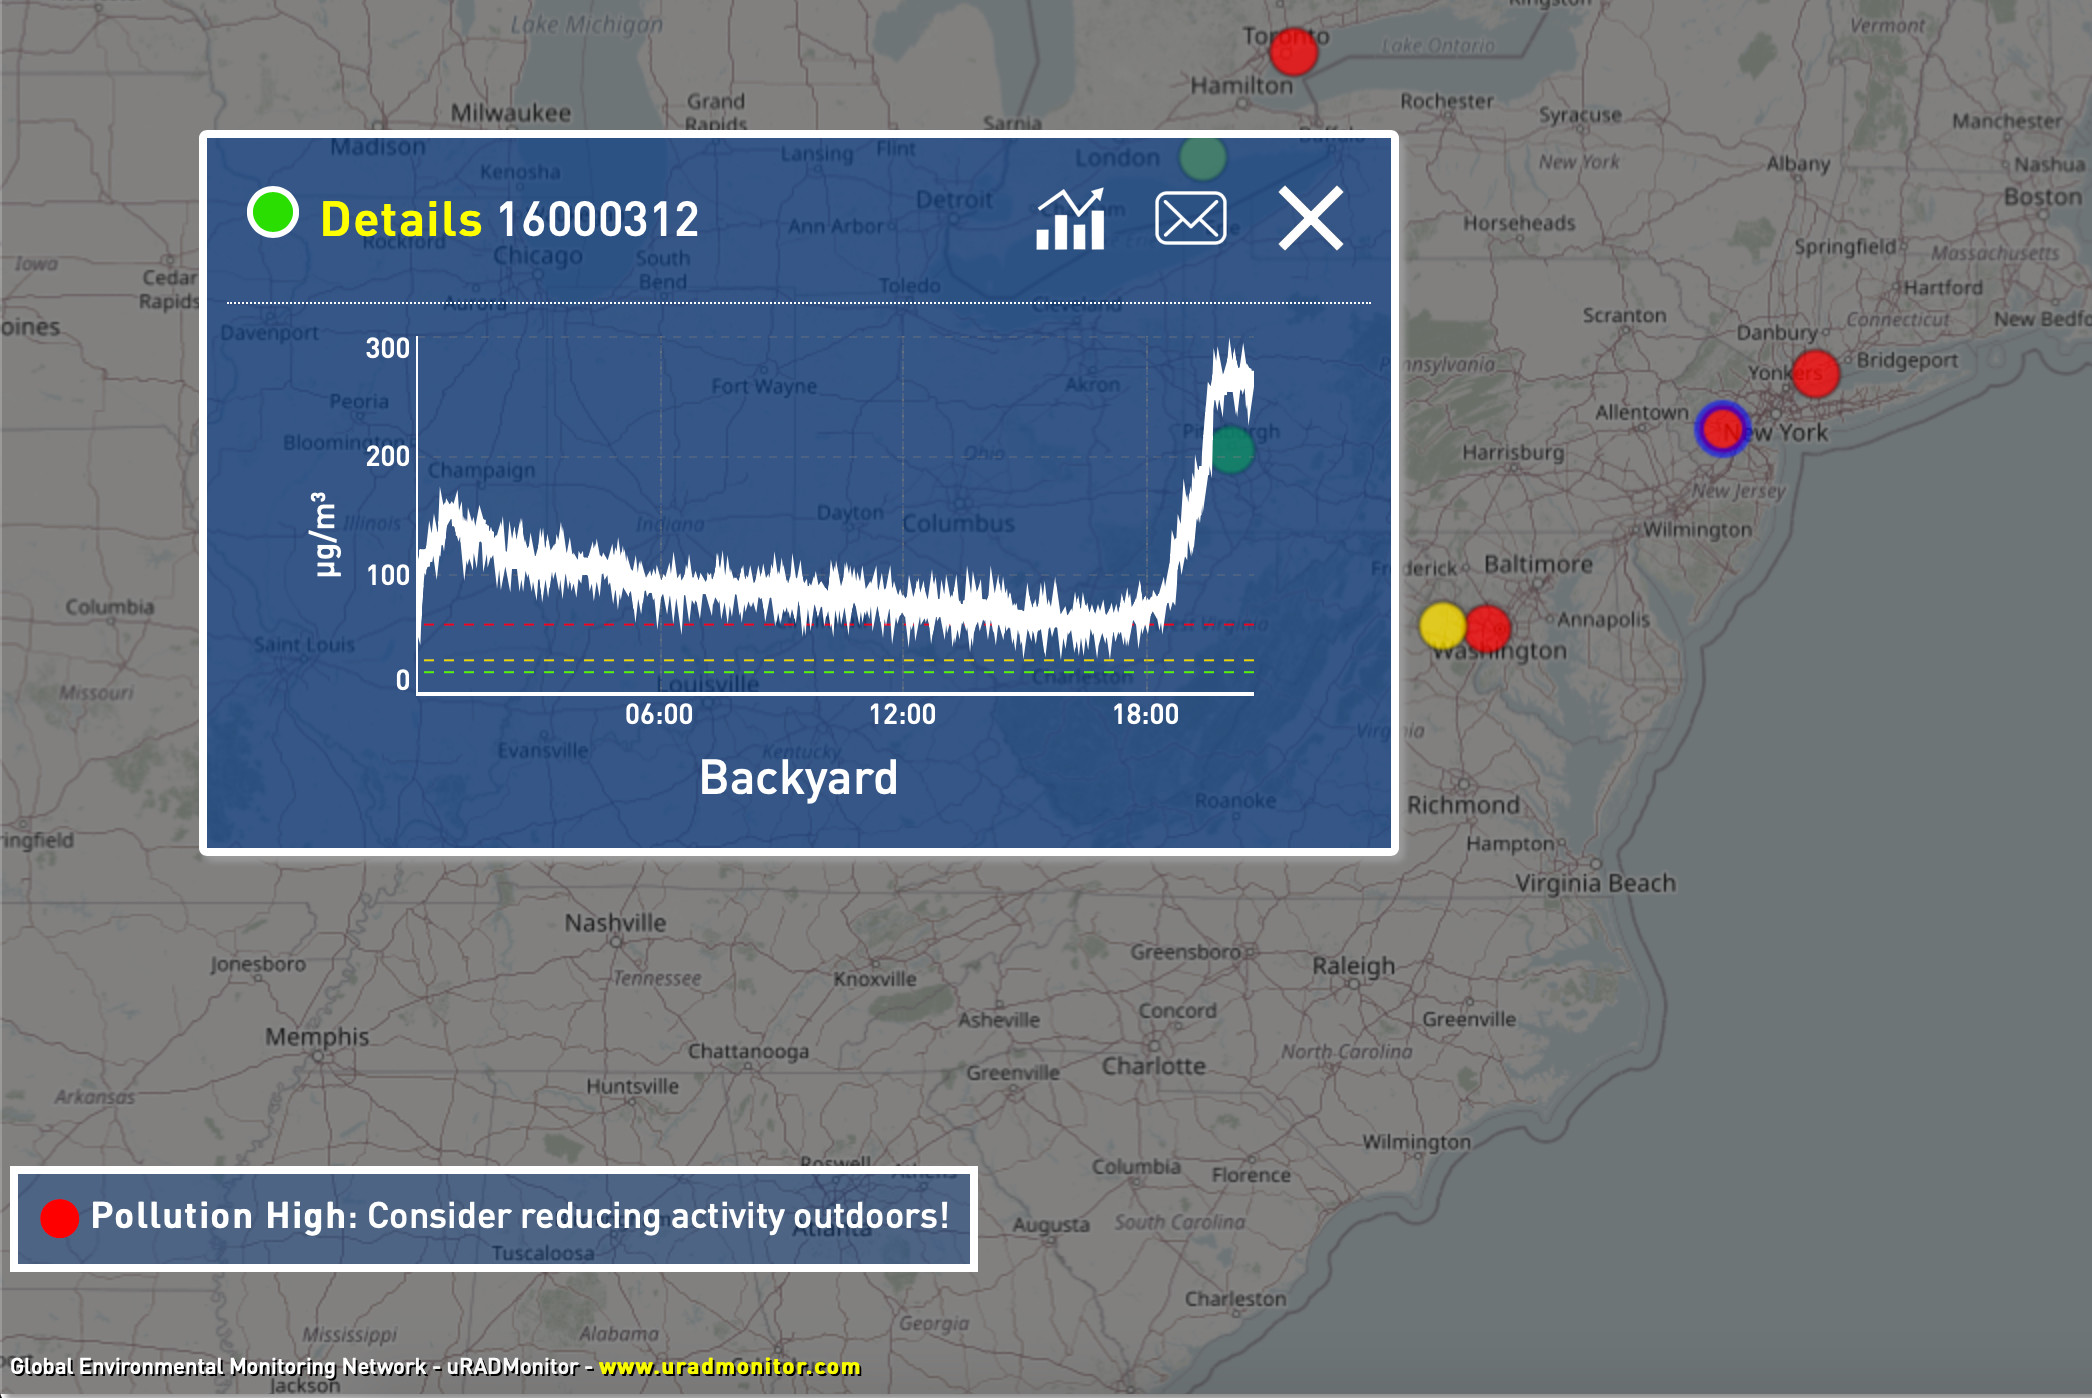
The air quality tends to recover as smoke gets dissipated and the wildfires are being controlled. Here’s a comparison with timestamps on the particulate matter concentrations recorded by multiple uRADMonitor #airquality sensors in US and Canada (Toronto, Montreal, New York, Washington DC) :
Most affected was New York with PM2.5 concentration exceeding 300ug/cubic meter (green color), followed hours later by Washington DC with little over 250.
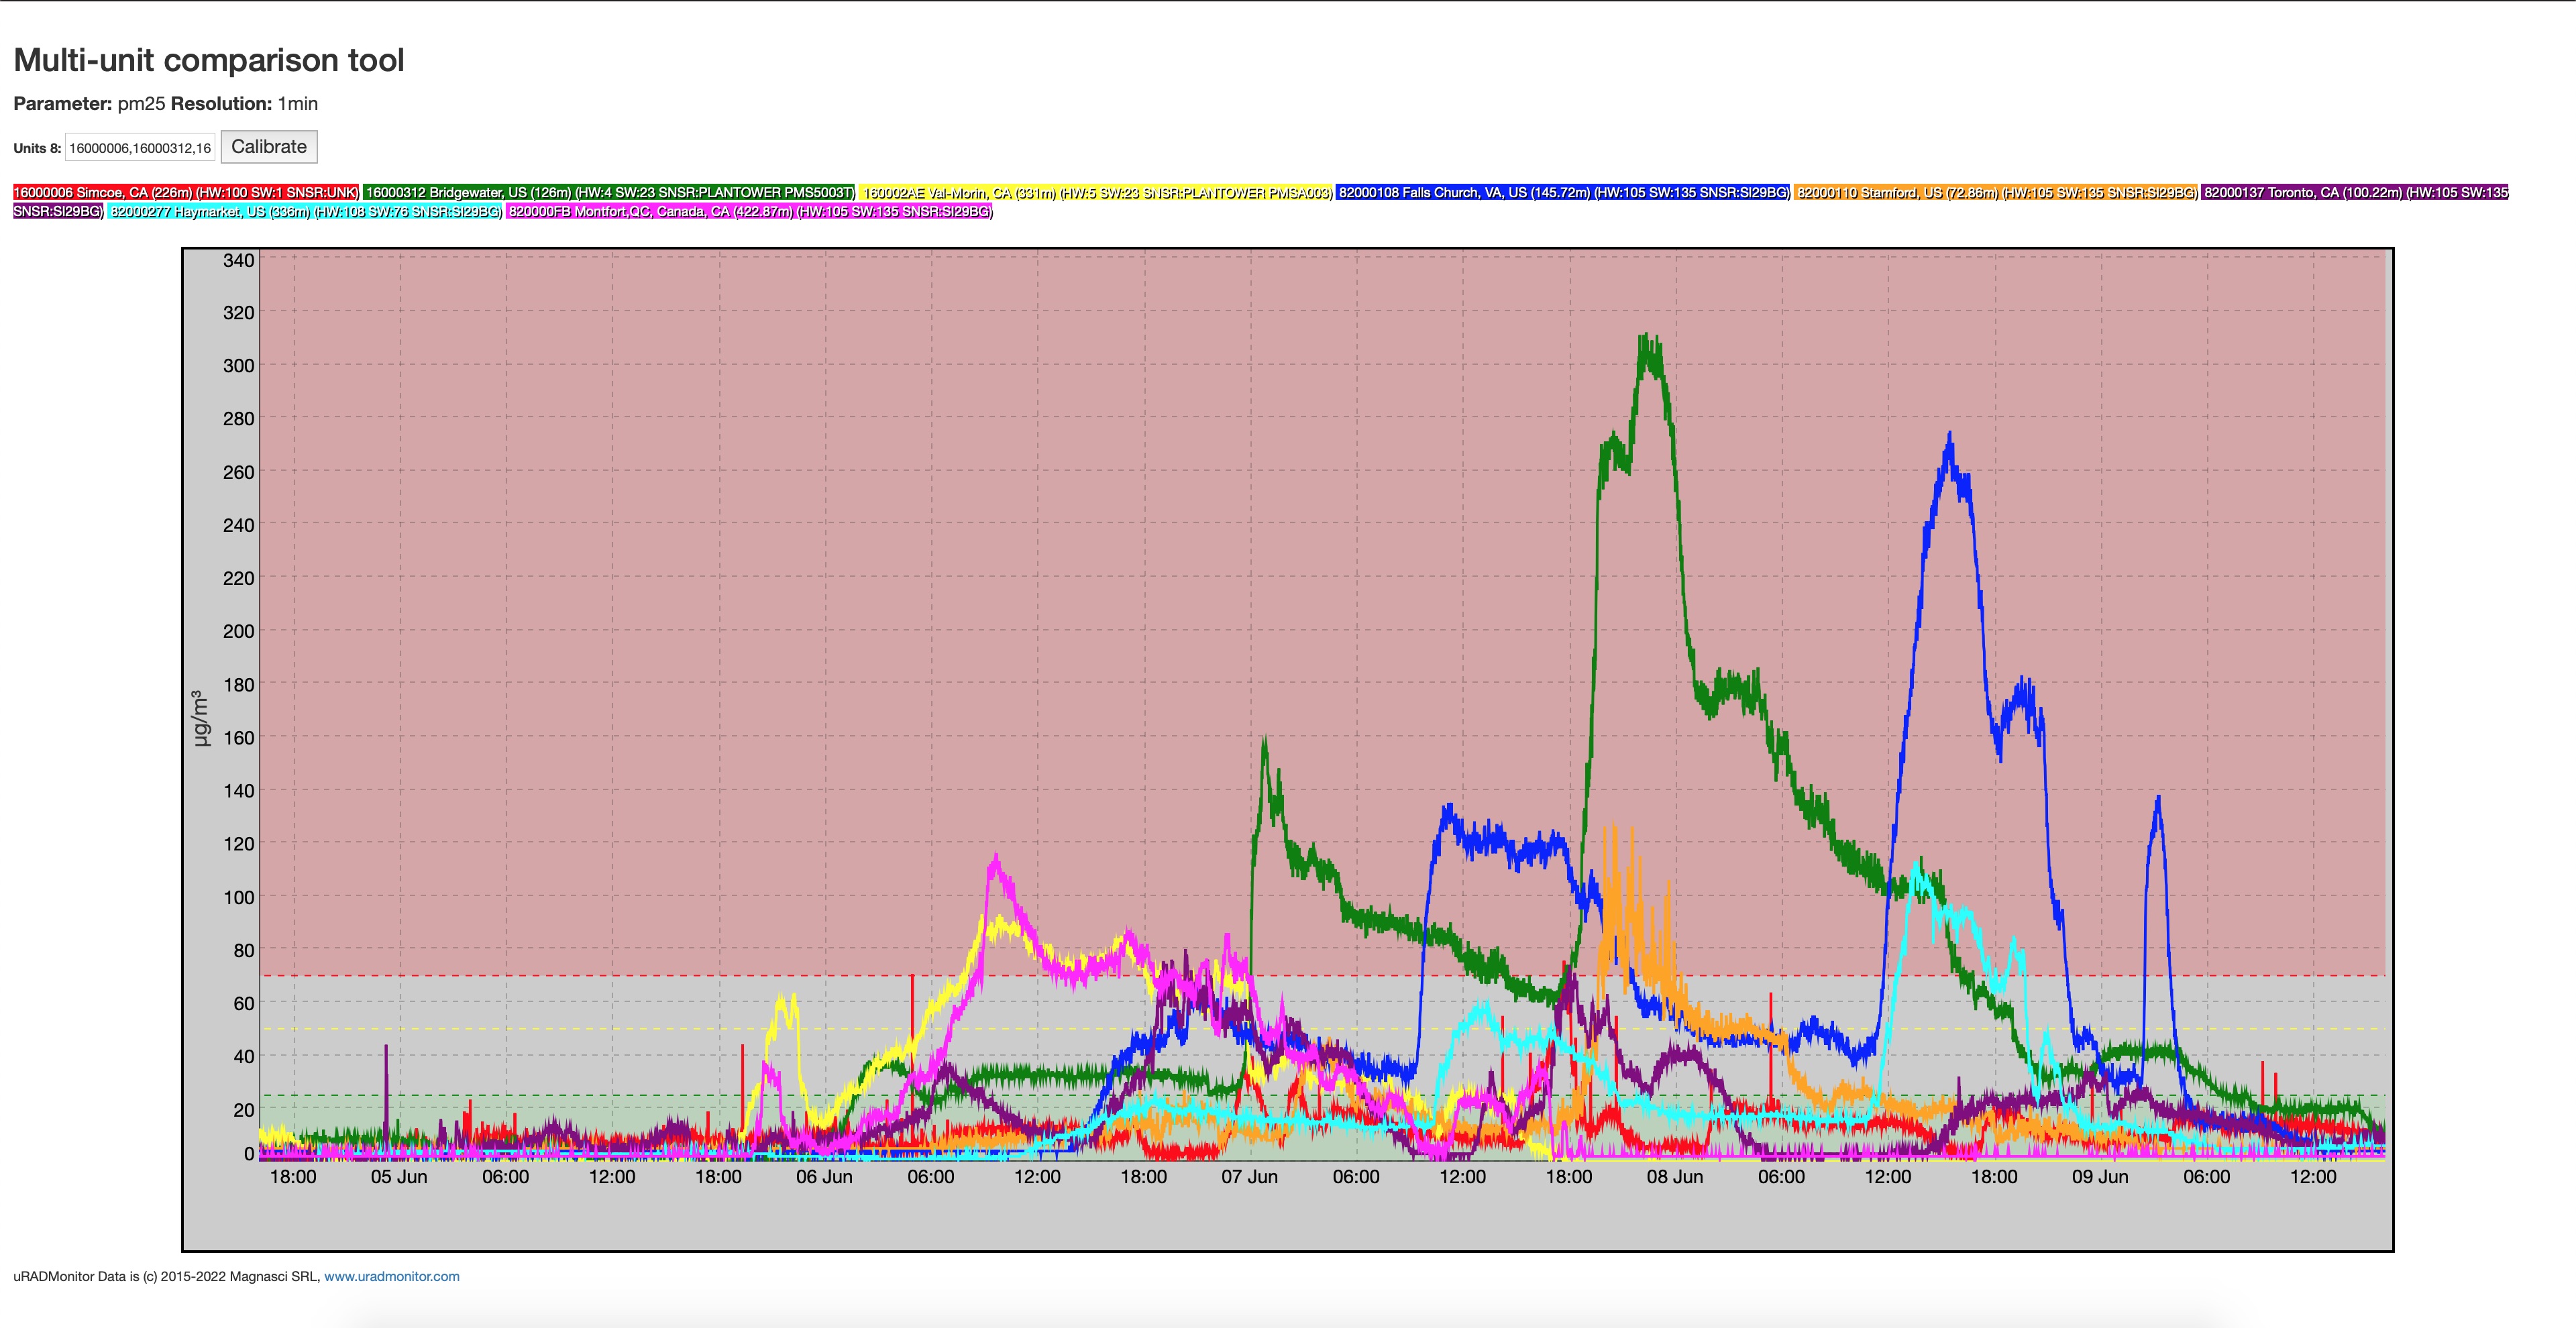
The time difference between the peaks can be used to understand the propagation of the smoke blankets and all aspects involved (speed, dissipation, etc).
codemore code
~~~~