- This topic has 9 replies, 5 voices, and was last updated 7 years, 4 months ago by
uRADMonitor.
-
AuthorPosts
-
September 4, 2018 at 12:45 pm #6010
daniweb
ParticipantHi,
I’m bit confused about the result of the VOC AIQ.
I just received the device this morning.
I see that most of the measured values are reported as not so bad (except CO2 with 730ppm).
CO2 = 730 ppm
PM1.0 = 1.6 ug/m3
PM10 = 3.81 ug/m3
Formaldehyde = 0.0 ppb (Is this correct??)
PM2.5 = 2.00 ug/m3
Temperature = 22.93 °C
Humidity = 55.10 %RH
VOC RAW = 159300 OhmDevice 820000FA at 14:23 September the 4th of 2018.
The VOC AIQ reports 348 and this is treated as severely polluted, this device is currently on my office at home (50cm from me).
Is this really a true result?PS: I tried to read shorty on the BSEC library and they are somewhere mentioning that this library needs some 4 or 28 days to perform automatic background calibration,… is something related to it?
September 4, 2018 at 1:21 pm #6011ParticipantI placed a bit of Windows cleaning product on my finger and I went near the A3 and it started to report some values like 155ppb.
September 5, 2018 at 12:43 pm #6019Stratos Zolotas
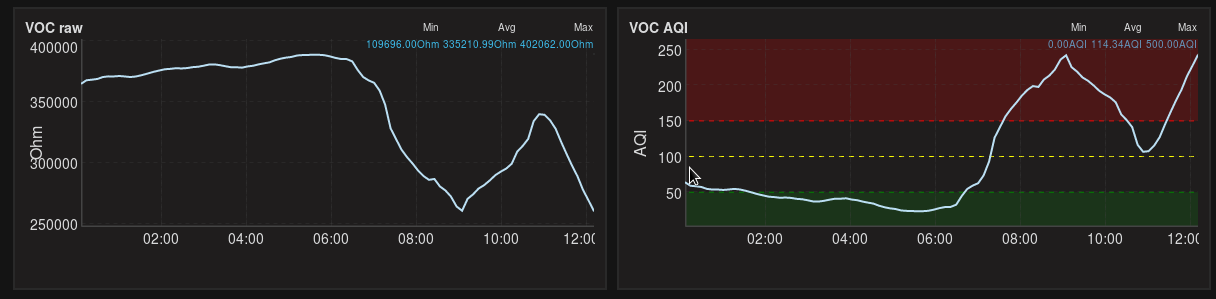
ParticipantHave the same question. How VOC raw vs VOC AQI works. I can see on my detailed view than when VOC raw drops, VOC AQI goes up an into the red areas. I’m attaching a screenshot which presents the correspondence.
Attachments:
September 5, 2018 at 9:32 pm #6027ParticipantI think this explains it:
“Measurement of VOC Concentration. You can detect high concentrations of VOCs in the surrounding air. The raw signal is a resistance value in ohms, which goes down with increasing VOC concentration.”
the link here: https://www.bluedot.space/sensor-boards/bme680/
September 10, 2018 at 8:43 am #6033ParticipantNow (10.09.2018 10:42) for the date time 14:23 September the 4th of 2018.
The VOC AIQ reports something like 17 and not anymore 348??
Hos is this calculated? all values at each request? When inserting the data?September 14, 2018 at 12:24 pm #6040ParticipantStill no reaction?
On the mean time on the room I added An oregon scientific device to measure the temperature and humidity.
The KNX SIemens is not exactly at the same place on the room, I left the door closed.uRADMonitor A3: 25.6 °C, 55.17 %RH CO2 386.79 ppm
Oregon Scientific: 21.8 °C, 64 %RH
KNX Siemens AQR: 21.2 °C, 67.24 %RH CO2 562.88 ppmRegarding CO2 I can not tell who is better, but for the temperature and humidity I think that the tendence vould be to tell that A3 is not so good (probably because of the internal fan….
September 16, 2018 at 10:43 pm #6041edodd55
ParticipantI was confused by this as well, but now understand that the raw data from the sensor needs some manipulation to provide the Air Quality Index. It seems to be an inverse relationship, but also requires the humidity data. Is the formula used for this available?
I have found the datasheet, with the basic instructions, and the python libraries, but am looking for any python code ready for use.March 18, 2019 at 8:52 am #6493ParticipantYeah, would be good if we have the formula from which the VOC AQI is calculated.
March 25, 2019 at 7:29 am #6498pfisi
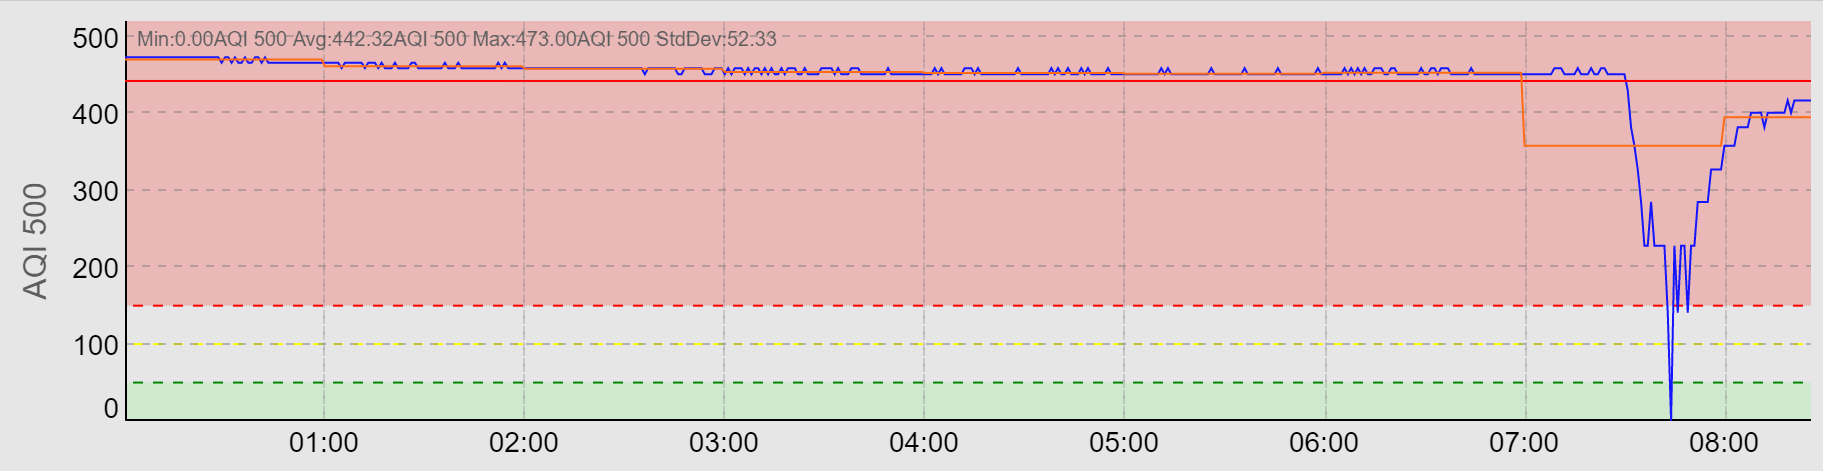
ParticipantHi all, on the VOC AIQ topic, I have constant values between 400 and 500, if I open the window it goes down to 200, as soon as I close the window – back to 400-500. Is it normal, something to be concerned?
Attachments:
April 1, 2019 at 7:19 pm #6501uRADMonitor
KeymasterThe VOC is not the easiest thing to interpret. You can read more on how a VOC sensor works: https://www.uradmonitor.com/metal-oxide-voc-sensors/
When Bosch manufactured their VOC capable BME680, they also provided a library that would compute a score 1 to 500 to do some estimations on the raw VOC levels. Sadly, this library was never integrated in the uRADMonitor products, it was too big for these embedded systems. On the other hand, current uRADMonitor devices are not using the BME680 anymore, it was too susceptible to failure.The way that lib worked was that it kept a given interval of raw VOC history data. It then used it to compute a baseline and have a reference point to any upcoming raw VOC reading.
I implemented a similar mechanism for the VOC AQI . The last 24 hours of VOC raw data is analysed and the interval min and max are kept. Any new VOC value is compared against the two, and scaled across a 1-500 interval.
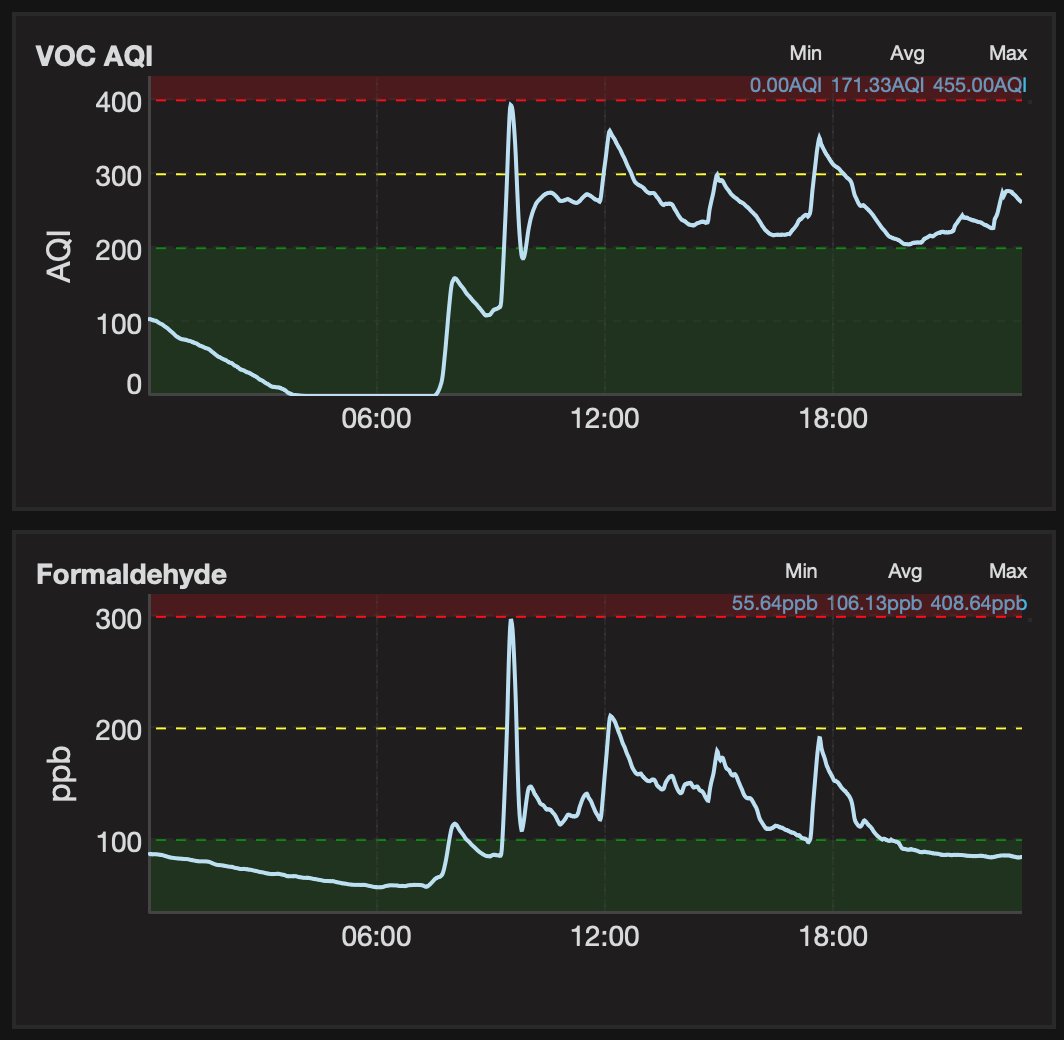
This approach worked amazingly well, and generated perfect alignments with other sensors, like the formaldehyde one. This was impressive as we are talking about two separated sensing elements, based on completely different detection technologies. See it here: https://twitter.com/RaduMotisan/status/1067894752027312128
There is a university in Canada currently using several A3 devices for research on how the VOC can be better used.Attachments:
-
AuthorPosts
- You must be logged in to reply to this topic.