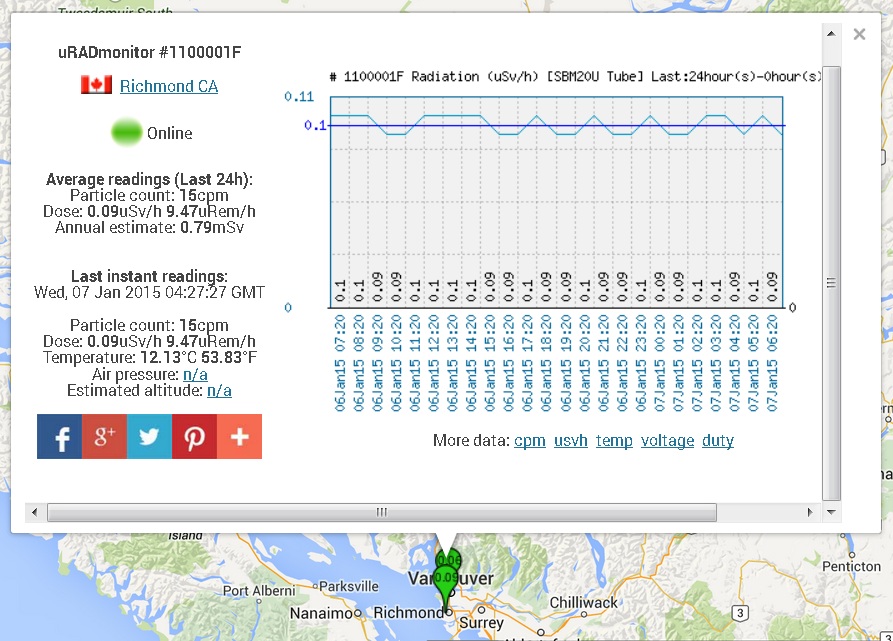
With reference to the attached screen capture (January 7 at 04:40 hours GMT):
* I don’t understand why the graph extends to 06:20 hours and beyond (and so do the graphs for the other two stations in the area). It would be helpful if all stations in the network were on the same GMT/UTC time base.
* uRAD uSv/hr graph lines look “saw tooth” and “square wave” because they are rounded off to and plotted with 2-place resolution. While that’s good enough accuracy for one hour averaging, the graphs would look a lot better with 3 decimal place plotting –as is done in uRAD’s uR/hr graph mode. (uRAD troubles to report temperature with _4_ place resolution and voltage to 5 places.)
* “Particle Count” –Hopefully, we are counting *clicks*, mostly from photonic gamma rays. If you’re counting beta or alpha particles, move the G-M tube further away from the offending surface (right?). (And if we’re counting muon particles –well sorry: there’s just no escape.)
* Congratulations on calling the SBM-20’s optimized sensitivity at about 16cpm in a 0.10 uSv/hr (average gamma only background assumed, and in lieu of a cesium-137 source and lab setup). Others have it wrong or simply don’t specify.
-
This topic was modified 11 years, 6 months ago by
 uRADMonitor.
.