- This topic has 1 reply, 2 voices, and was last updated 10 years, 11 months ago by
RobHeffo.
-
AuthorPosts
-
August 1, 2015 at 10:48 am #2165
Martin Roth
ParticipantBased on the script by Pixel_K, here is how to set up local RRD graphs for your uradmonitor on a local linux system.
I have originally done this directly on my pfsense router, but it turns out this is not a good idea. Since my pfsense router boots of a Compact Flash memory card and does not have a harddisk, it replaces its file systems on each boot and only preserves very selective data when upgrading the system, removing my installation on reboot/upgrade.
However, I installed Ubuntu Linux on an old small PC, which I set up mainly to do backups.
If you don’t have the command rrdtool, install it with sudo apt-get install rrdtool
Same if you don’t have the command curl, install with sudo apt-get install curlI put the scripts and data files in /usr/local/urad. In there, create the following file:
Script to test reading current values from the uradmonitor, curr.sh:
#!/bin/sh

URL=http://10.0.0.101/j
rrdpath="/usr/local/bin"

jsondata=$( curl -s $URL);

v_cpm=$( echo $jsondata | cut -f 3 -d "," | cut -f 2  -d ":" )
v_temp=$( echo $jsondata | cut -f 4 -d "," | cut -f 2  -d ":" )

echo CPM : $v_cpm
echo Temperature : $v_temp
Get this script working first! Replace your IP number in the URL of your uRadMonitor. Run with sh curr.sh.
The next script needs to run only once, to set up the RRD Database, setup.sh:
#!/bin/sh

rrdpath="/usr/bin"
rrddata="/usr/local/urad/data"
rrdgraph="/usr/local/urad/graph"

mkdir $rrddata
mkdir $rrdgraph

   $rrdpath/rrdtool create $rrddata/uRadMonitor.rrd -s 60 \
            DS:cpm:GAUGE:300:0:U   \
            DS:temp:GAUGE:300:-100:100  \
            RRA:AVERAGE:0.5:1:600  \
            RRA:AVERAGE:0.5:6:700  \
            RRA:AVERAGE:0.5:24:775 \
            RRA:AVERAGE:0.5:288:797 \
            RRA:MAX:0.5:1:600 \
            RRA:MAX:0.5:6:700 \
            RRA:MAX:0.5:24:775 \
            RRA:MAX:0.5:288:797
   echo database $rrddata/uRadMonitor.rrd created.
Run this sript once to set up the RDD database: sh setup.sh
Next, create the script to store the current value and update the graphs, update.sh:
#!/bin/sh

URL=http://10.0.0.101/j
rrdpath="/usr/bin"
rrddata="/usr/local/urad/data"
rrdgraph="/usr/local/urad/graph"
rrdfmt="--font AXIS:6: --font TITLE:9: --font UNIT:7: --font LEGEND:7: --font-render-mode mono --color ARROW#000000 --color GRID#
8C8C8C --color MGRID#000000 -v \"cpm\" --alt-y-mrtg --width 600"

jsondata=$( curl -s $URL );

v_cpm=$( echo $jsondata | cut -f 3 -d "," | cut -f 2  -d ":" )
v_temp=$( echo $jsondata | cut -f 4 -d "," | cut -f 2  -d ":" )

echo CPM : $v_cpm
echo Temperature : $v_temp

$rrdpath/rrdtool update $rrddata/uRadMonitor.rrd N:$v_cpm:$v_temp

$rrdpath/rrdtool graph --imgformat PNG $rrdgraph/rad-day.png   --start -86400 --end -600 --title "Radiation daily" $rrdfmt \
        DEF:cpm=$rrddata/uRadMonitor.rrd:cpm:AVERAGE \
                AREA:cpm#00CCCC:"Count Per Minute\g" \
                        GPRINT:cpm:MAX:"  Max \: %5.1lf " \
                        GPRINT:cpm:AVERAGE:" Avg \: %5.1lf " \
                        GPRINT:cpm:LAST:" Last \: %5.1lf \l"

$rrdpath/rrdtool graph --imgformat PNG $rrdgraph/rad-week.png  --start -604800   -z    --title "Radiation weekly" $rrdfmt \
        DEF:cpm=$rrddata/uRadMonitor.rrd:cpm:AVERAGE \
                AREA:cpm#00CCCC:"Count Per Minute\g" \
                        GPRINT:cpm:MAX:"  Max \: %5.1lf " \
                        GPRINT:cpm:AVERAGE:" Avg \: %5.1lf " \
                        GPRINT:cpm:LAST:" Last \: %5.1lf \l"

$rrdpath/rrdtool graph --imgformat PNG $rrdgraph/rad-month.png --start -2592000  -z    --title "Radiation monthly" $rrdfmt \
        DEF:cpm=$rrddata/uRadMonitor.rrd:cpm:AVERAGE \
                AREA:cpm#00CCCC:"Count Per Minute\g" \
                        GPRINT:cpm:MAX:"  Max \: %5.1lf " \
                        GPRINT:cpm:AVERAGE:" Avg \: %5.1lf " \
                        GPRINT:cpm:LAST:" Last \: %5.1lf \l"

$rrdpath/rrdtool graph --imgformat PNG $rrdgraph/rad-year.png  --start -31536000 -z    --title "Radiation yearly" $rrdfmt \
        DEF:cpm=$rrddata/uRadMonitor.rrd:cpm:AVERAGE \
                AREA:cpm#00CCCC:"Count Per Minute\g" \
                        GPRINT:cpm:MAX:"  Max \: %5.1lf " \
                        GPRINT:cpm:AVERAGE:" Avg \: %5.1lf " \
                        GPRINT:cpm:LAST:" Last \: %5.1lf \l"

$rrdpath/rrdtool graph --imgformat PNG $rrdgraph/rad-decade.png  --start -315360000 -z    --title "Radiation decade" $rrdfmt \
        DEF:cpm=$rrddata/uRadMonitor.rrd:cpm:AVERAGE \
                AREA:cpm#00CCCC:"Count Per Minute\g" \
                        GPRINT:cpm:MAX:"  Max \: %5.1lf " \
                        GPRINT:cpm:AVERAGE:" Avg \: %5.1lf " \
                        GPRINT:cpm:LAST:" Last \: %5.1lf \l"
Again, adjust your URL and paths, if necessary. Run manually using sh update.sh and check that png files in /var/urad/graph are generated and updated.
When everything is working, create a crontab file to run the update script every minute, uradcontab:
* * * * * /bin/sh /var/urad/update.sh > /dev/null 2> /dev/nullInstall the crontab with crontab /usr/local/urad/uradcrontab
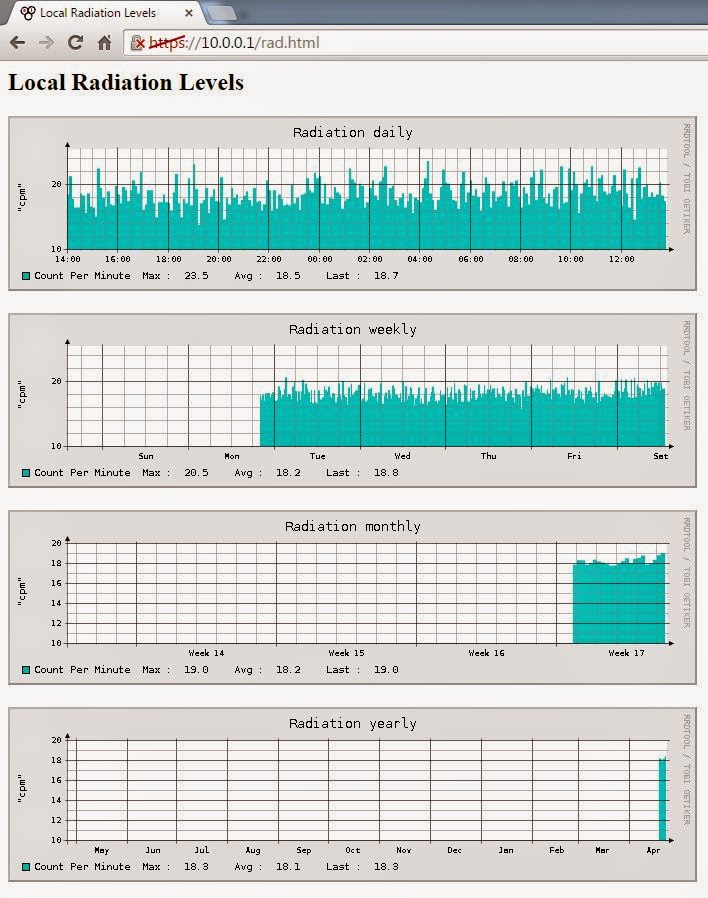
The Ubuntu install comes with the webserver apache already included. The local content for the web server is typically in /var/www/html. Create an HTML page which pulls in the latest images, for example /var/www/html/urad.html:
<HTML>
  <HEAD>
    <TITLE>Local Radiation Levels</TITLE>
  </HEAD>
  <BODY>
    <H2>Local Radiation Levels</H2>
    <IMG SRC="rad-day.png"/>
    <BR/>
    <BR/>
    <IMG SRC="rad-week.png"/>
    <BR/>
    <BR/>
    <IMG SRC="rad-month.png"/>
    <BR/>
    <BR/>
    <IMG SRC="rad-year.png"/>
    <BR/>
    <BR/>
    <IMG SRC="rad-decade.png"/>
  </BODY>
</HTML>
Finally, create soft-links to the image files in the /var/www/html directory, so the images become web-acessible (internal network only):
ln -s /usr/local/urad/graph/*.png /var/www/htmlYou should be access your uradmonitor RRD graphs on your webserver at http://your_ip_number/urad.html.
Thanks to Pixel_K for figuring out the rrdtool commands, so that we don’t have to! The attached ZIP file contains all the scripts above.
-
This topic was modified 10 years, 11 months ago by
Martin Roth.
-
This topic was modified 10 years, 11 months ago by
Attachments:
August 6, 2015 at 5:57 am #2209RobHeffo
ParticipantThe scripts work well. I have it running on a Raspberry Pi 2 with no problems.
I did need to tweak the “cut” commands as the JSON from my uRadmonitor has the detector type in position 3.So, in both curr.sh and update.sh I needed to replace…
v_cpm=$( echo $jsondata | cut -f 3 -d "," | cut -f 2  -d ":" )
v_temp=$( echo $jsondata | cut -f 4 -d "," | cut -f 2  -d ":" )
with
v_cpm=$( echo $jsondata | cut -f 4 -d "," | cut -f 2 -d ":" ) v_temp=$( echo $jsondata | cut -f 5 -d "," | cut -f 2 -d ":" ) -
This topic was modified 10 years, 11 months ago by
-
AuthorPosts
- You must be logged in to reply to this topic.