- This topic has 12 replies, 4 voices, and was last updated 10 years, 9 months ago by
cristianst85 (nox).
-
AuthorPosts
-
May 21, 2015 at 3:23 am #1942
David
ParticipantHi All,
I was interested in seeing how the readings from my uRAD Monitor related with the current weather conditions (wind, rain, humidity, temp, etc) so I purchased a cheap weather station off eBay and set about configuring a way to collect, store and display data from the uRAD monitor and weather station.
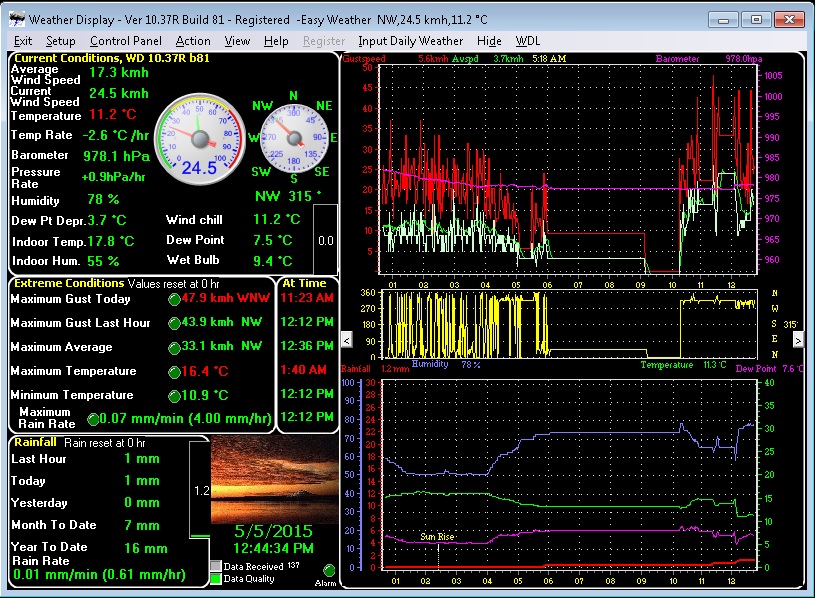
The software included with the weather station was very basic so I found another program that interfaces with it called “Weather Display” which includes the ability to write observations to mysql.
I then wrote a Python script to poll the uRad monitor every 5 minutes and add that data to another mysql table.
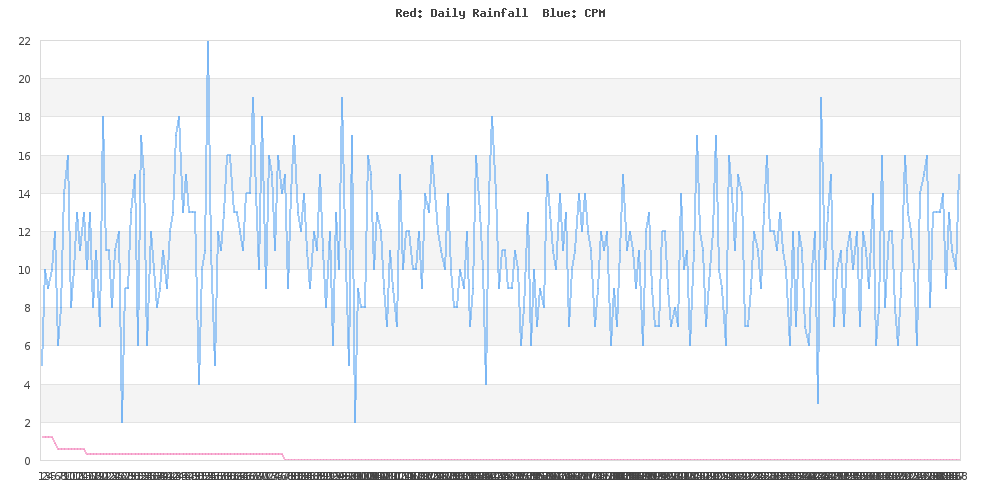
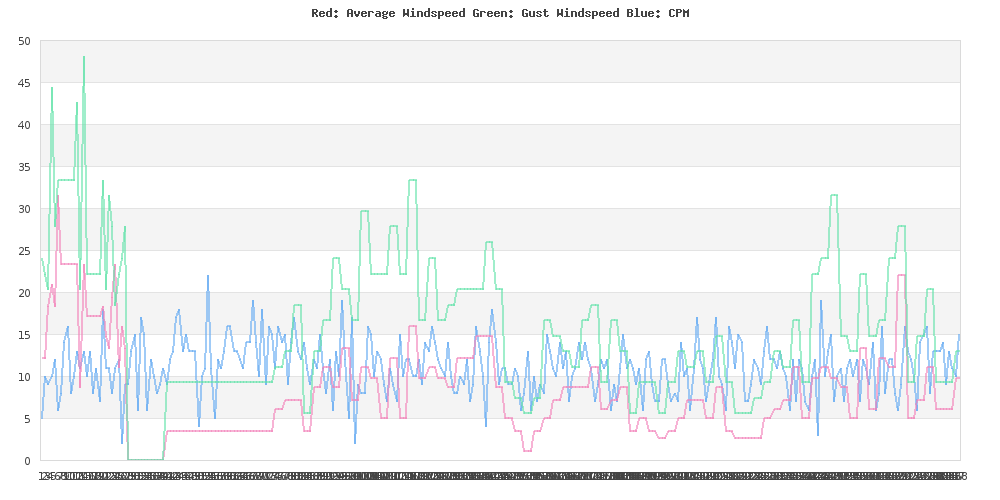
Using PHP and jgraph I created a few graphs showing Rain, wind speed and temp/humidity vs CPM which you can see attached below.
Currently I am having some issues with the weather station reporting back to it’s base station causing flat lines in the graphs. I’m not sure if this is just flat batteries or something else yet.
Once I have this sorted I intend on adding further sensors to my array such as air quality, etc.
Let me know what you think,
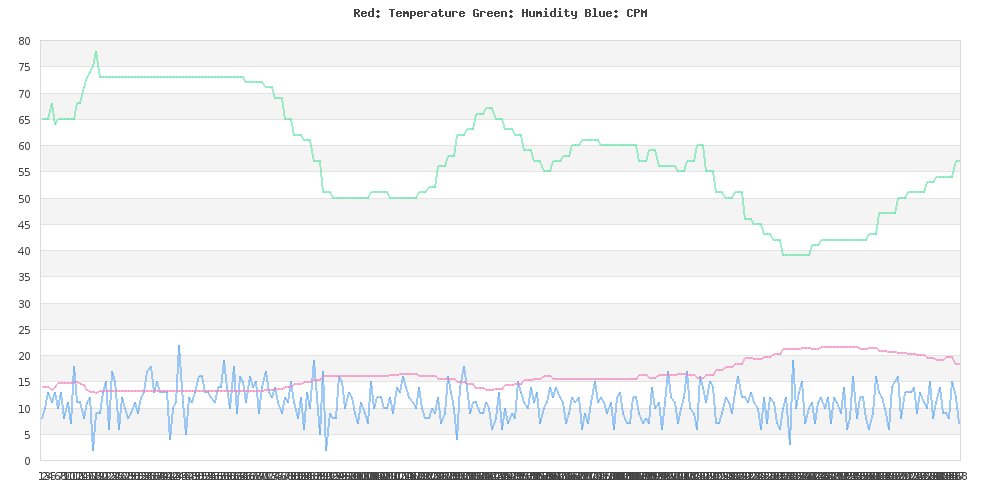
DavidMay 21, 2015 at 3:28 am #1945ParticipantAttached is Temp/Humidity graph as well as screenshot of Weather Display software.
Attachments:
May 21, 2015 at 4:59 am #1948ParticipantHere is the python script I’m using to pull data from the uRAD monitor into mysql in case anybody is interested.
import time
import json
import MySQLdb
import urllib2
response = urllib2.urlopen('http://192.168.1.225/j')
html=response.read()
result = json.loads(html)
data = result['data']['temperature']
cpm = result['data']['cpm']

db = MySQLdb.connect(host="localhost",user="username",passwd="password",db="temps")
curs=db.cursor()

try:
	curs.execute ("INSERT INTO urad (tdate, time, temperature,cpm) VALUES (CURRENT_DATE(), NOW(), %s, %s) """, (data, cpm))
	db.commit()

except db.Error, e:
        print "Error %d: %s" % (e.args[0],e.args[1])
        db.rollback()

db.close()
May 21, 2015 at 4:25 pm #1949Steve
ParticipantLooks good David.
You’re just sightly north of me. I’m #11000061
I’ve just started gathering my uRad data into a MySQL database but display it independently to my weather station data. I’d like to incorporate my radiation data with my weather data but it exceeds my skills at present, but I’m working on it.
I’m going to try and work with your Python script, thanks for sharing it.
My PHP script I’m currently using is:
<?php
    //connect to mysql db
    $con = mysql_connect("localhost","myDatabase","myPassWord") or die('Could not connect: ' . mysql_error());
    //connect to the urad database
    mysql_select_db("myDatabase, $con);

    //read the json file contents
    $jsondata = file_get_contents('http://uradmonitor-61/j');

    //convert json object to php associative array
    $data = json_decode($jsondata, true);

    //get the data
    $id = $data['data']['id'];
    $type = $data['data']['type'];
    $detector = $data['data']['detector'];
    $cpm = $data['data']['cpm'];
    $temperature = $data['data']['temperature'];
    $uptime = $data['data']['uptime'];
    $timestamp = date('Y-m-d H:i:s', time());

    //insert into mysql table
    $sql = "INSERT INTO data(id, type, detector, cpm, temperature, uptime, timestamp)
    VALUES('$id', '$type', '$detector', '$cpm', '$temperature', '$uptime', '$timestamp')";
    if(!mysql_query($sql,$con))
    {
        die('Error : ' . mysql_error());
    }
?>
So far it looks like this-> http://wotid.dyndns.org/solarhtml/radiation.php
Regards,
Steve
-
This reply was modified 11 years, 1 month ago by
Steve. Reason: Security
May 22, 2015 at 12:41 am #1951ParticipantThose graphs look really nice Steve, what are you using to generate those?
I’m using jpgraph for mine which seems to be alright but as you can see from the above I’m yet to refine them into nice looking ones.
Apache, PHP, MYSQL are all running on a Debian VM and a cron job runs every 5 minutes with that python script to poll the data into MYSQL.
Weather data is injected using Weather Display which runs on a Windows 7 VM.
I noticed you are using “weewx” for yours I may have to give that a look as the less stuff I have running on the Windows 7 VM the better.All of this data is stored in one MYSQL database called “temps” this includes a table for uRAD, weather, bathroom, laundry and rack.
The last three being for my home automation system to control extraction fans.
I then use jpgraph and PHP to pull data from the tables.
This is the PHP script for the Wind vs CPM graph. (I’m far from good with programming so it’s a bit of a mess)<?php // content="text/plain; charset=utf-8" define('__ROOT__', dirname(dirname(__FILE__))); require_once ('../jpgraph/jpgraph.php'); require_once ('../jpgraph/jpgraph_line.php'); require_once ('../jpgraph/jpgraph_error.php'); $x_axis = array(); $y_axis = array(); $y1_axis = array(); $y2_axis = array(); $i = 0; $con=mysqli_connect("localhost","username","password","temps"); // Check connection if (mysqli_connect_errno()) { echo "Failed to connect to MySQL: " . mysqli_connect_error(); } $result = mysqli_query($con,"SELECT * FROM urad ORDER BY <code>id</code> DESC LIMIT 288"); while($row = mysqli_fetch_array($result)) { $x_axis[$i] = $row["time"]; $y_axis[$i] = $row["cpm"]; $i++; } $i = 0; $result = mysqli_query($con,"SELECT * FROM weather ORDER BY <code>datetime</code> DESC LIMIT 288"); while($row = mysqli_fetch_array($result)) { $y1_axis[$i] = $row["average_windspeed"]; $i++; } $i = 0; $result = mysqli_query($con,"SELECT * FROM weather ORDER BY <code>datetime</code> DESC LIMIT 288"); while($row = mysqli_fetch_array($result)) { $y2_axis[$i] = $row["gust_windspeed"]; $i++; } mysqli_close($con); $graph = new Graph(1000,500); $graph->img->SetMargin(40,40,40,40); $graph->img->SetAntiAliasing(); $graph->SetScale("textlin"); $graph->SetShadow(); $graph->title->Set("Red: Average Windspeed Green: Gust Windspeed Blue: CPM"); $graph->title->SetFont(FF_FONT1,FS_BOLD); // Use 20% "grace" to get slightly larger scale then min/max of // data $graph->yscale->SetGrace(0); $p1 = new LinePlot($y_axis); //$p1->mark->SetType(MARK_FILLEDCIRCLE); //$p1->mark->SetFillColor("red"); $p1->mark->SetWidth(2); $p1->SetColor("blue"); $p1->SetCenter(); $graph->Add($p1); $p2 = new LinePlot($y1_axis); //$p2->mark->SetType(MARK_FILLEDCIRCLE); //$p2->mark->SetFillColor("red"); $p2->mark->SetWidth(2); $p2->SetColor("red"); $p2->SetCenter(); $graph->Add($p2); $p3 = new LinePlot($y2_axis); //$p2->mark->SetType(MARK_FILLEDCIRCLE); //$p2->mark->SetFillColor("red"); $p3->mark->SetWidth(2); $p3->SetColor("green"); $p3->SetCenter(); $graph->Add($p3); $graph->Stroke(); ?>May 22, 2015 at 12:54 am #1952ParticipantMy graphs are generated by Highcharts ( http://www.highcharts.com/ )
All my monitoring is running on a Raspberry Pi Model B 2. It seems to cope with the load and it doesn’t use much power.
I used to use a weather station like you have (WH1080) with WeeWx, but upgraded to the WH3080 for the UV and Solar Radiation data, but there’s something wrong with my sensors and the data is useless, so I don’t even display them on the current observations page.
Steve.
May 22, 2015 at 2:43 am #1953ParticipantThey look quite good I’ll have to have a play with them over the weekend and see what I can come up with 🙂
I have found the reliability of the station to be a bit hit and miss so far, I was considering something like the AirPi and adding wind/rain to it but I may wait to see what which sensors Radu goes with on the new model D and start from there so that data is comparable on the global network.
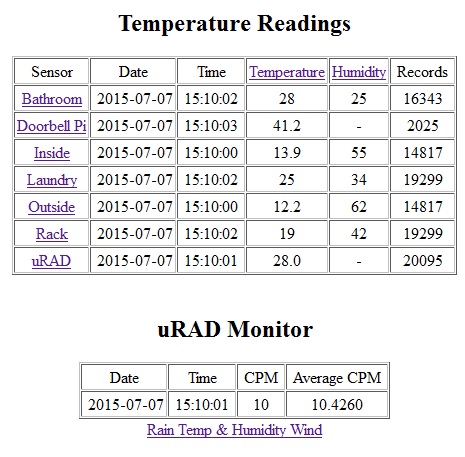
July 7, 2015 at 5:28 am #2043ParticipantBit of an update.
Now have around 14,000 data points from the weather station but the radio link still has random issues and will report the same data repeatedly.
I’m yet to figure out exactly why but am going to try moving the weather station to see if the issue is interference.I also intend on building another sensor array to be mounted near the uRAD monitor witch will include:
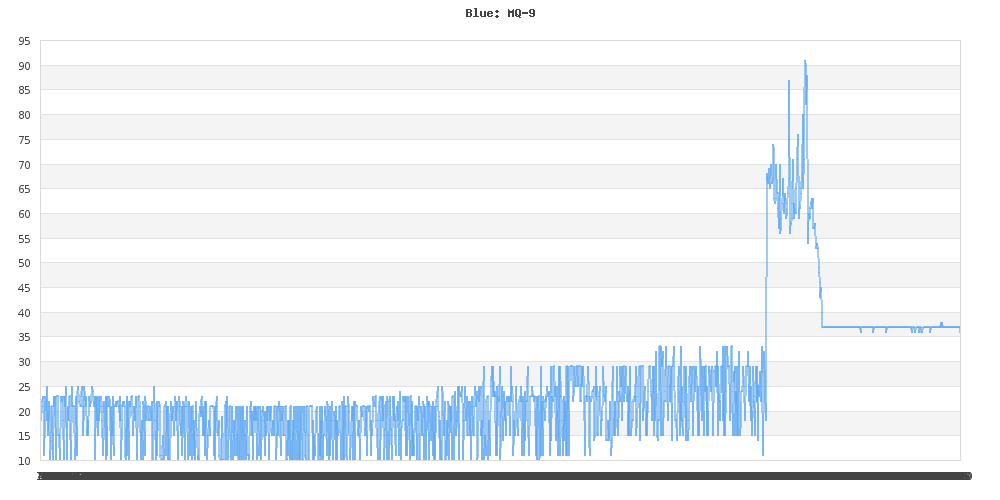
MQ-9 – Carbon monoxide, Methane, Propane, LPG
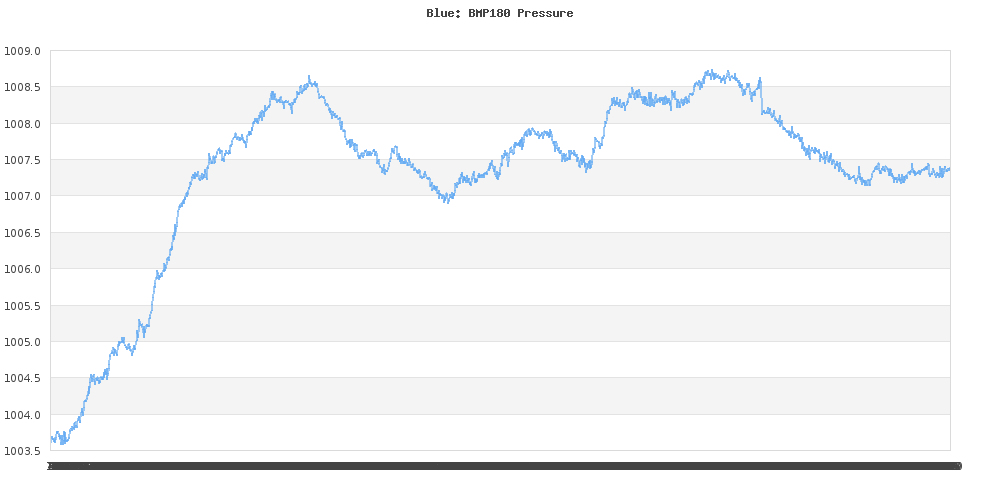
BMP180 – Barameteric pressure
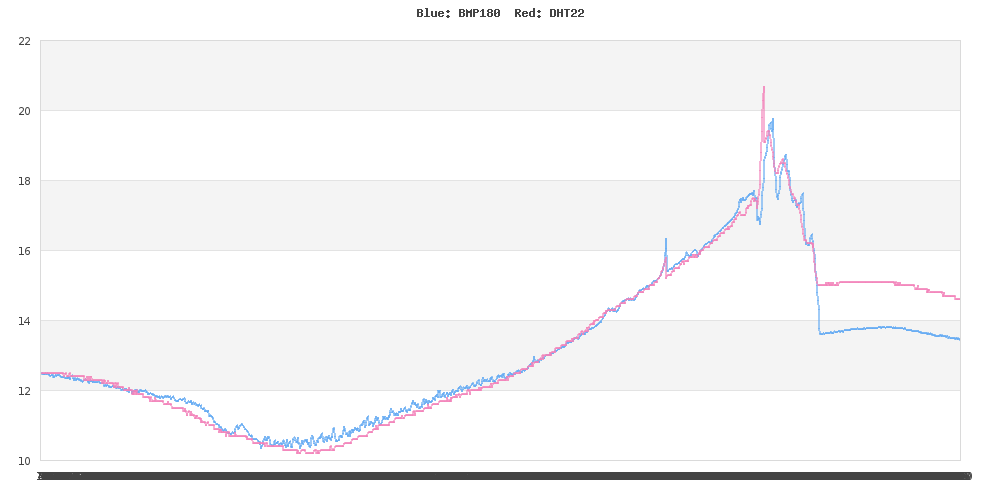
DHT22 – Temperature and humidity
and possibly some more air quality sensors.I’m just awaiting delivery for them to begin the build.
Attachments:
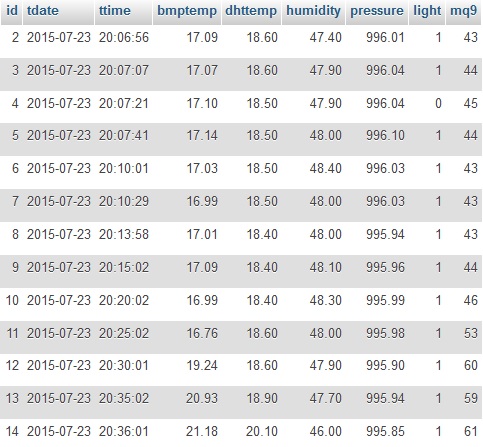
July 29, 2015 at 6:38 am #2144ParticipantHave started testing the new set of sensors out. Waiting on a case to put it all in and the plan is to put it as close as possible to the uRAD monitor so data can be compared.
Attached are the last 24 hours of testing (sensors are currently inside)
I’ve configured both the temp sensor in the BMP180 and a DHT22 temp/humidity. The DHT22 seems a bit quicker to respond to changes but both are rather close.
July 29, 2015 at 7:41 am #2149uRADMonitor
KeymasterThat looks great David. All the code and details would make a good topic for a dedicated blog post, would you be interested in writing one? It’s a better way to share interesting things then this forum, where the high number of topics tend to cover previous entries. I think your account has the right privileges already.
July 30, 2015 at 10:53 am #2151ParticipantI’d be quite happy to Radu 🙂
I’ll see what I can put together.
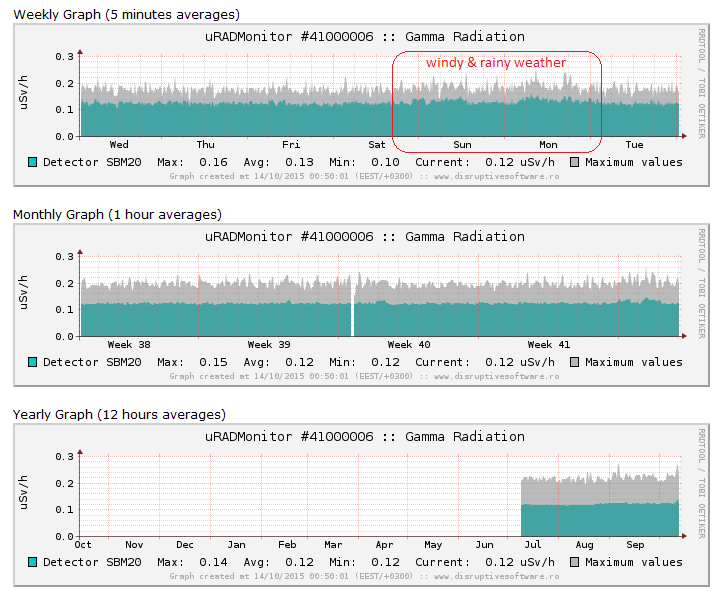
October 16, 2015 at 5:32 pm #2514cristianst85 (nox)
ModeratorAt the end of last week (Saturday thru Monday) we got some windy and rainy weather here in Bucharest. I’ve noticed a slight increase in background radiation those days. Probably if my unit was closer to the ground the readings would have been more accurate.
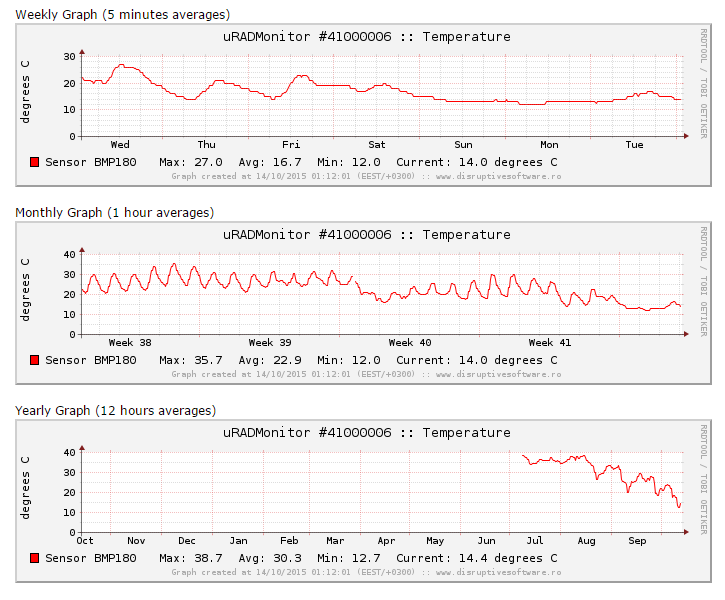
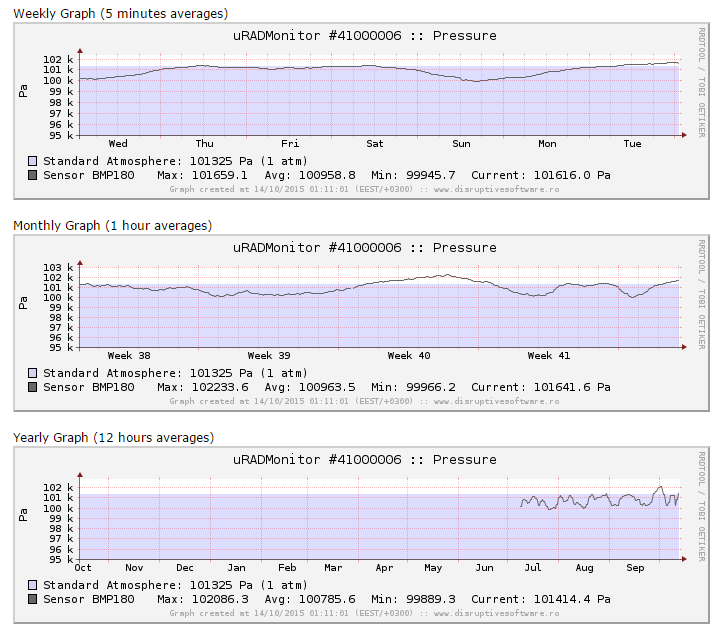
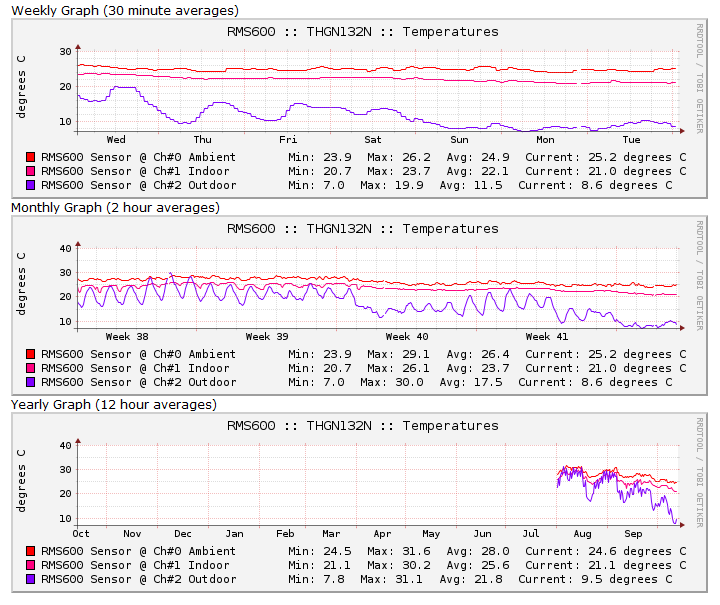
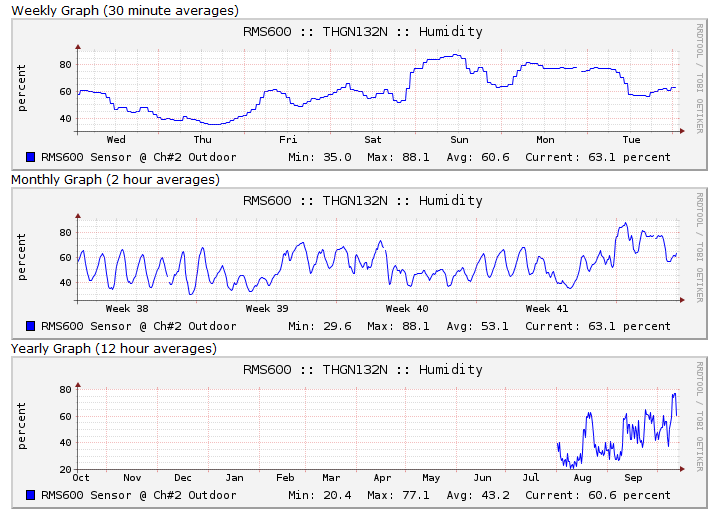
October 16, 2015 at 5:33 pm #2518ModeratorAnd the readings from my weather station (Oregon Scientific RMS600) sensors for that week.
-
AuthorPosts
- You must be logged in to reply to this topic.