Hi guys,
Here are some changes you might have noticed already:
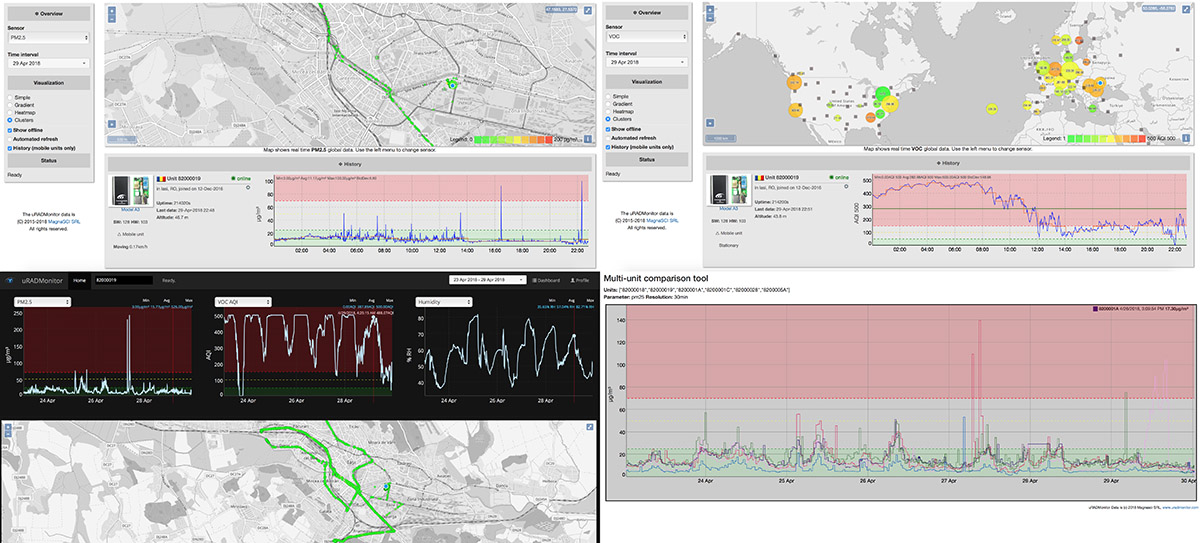
-The frontend now shows the dangerous / legal limits for the various Air pollutants for every chart and sensor. You’d want the green interval to be on the safe side
– chart display has been improved, showing some details like min / max / average / standard deviation, all computed for the time interval selected
– VOC raw data previously displayed as resistance across the sensor is now computed as AQI (0..500) for all VOC sensors across the network. Also the API returns the VOC AIQ instead. This makes comparisons easy, and gives a more absolute meaning to this parameter
Any feedback would be helpful!
.