Some math before sleep…
I’m thinking about automatic classifying the uRad-devices related to (for example) reliability, abuse, indoor/outdoor, real incident, … I’d like to use as view values as possible, just the CPM over time.
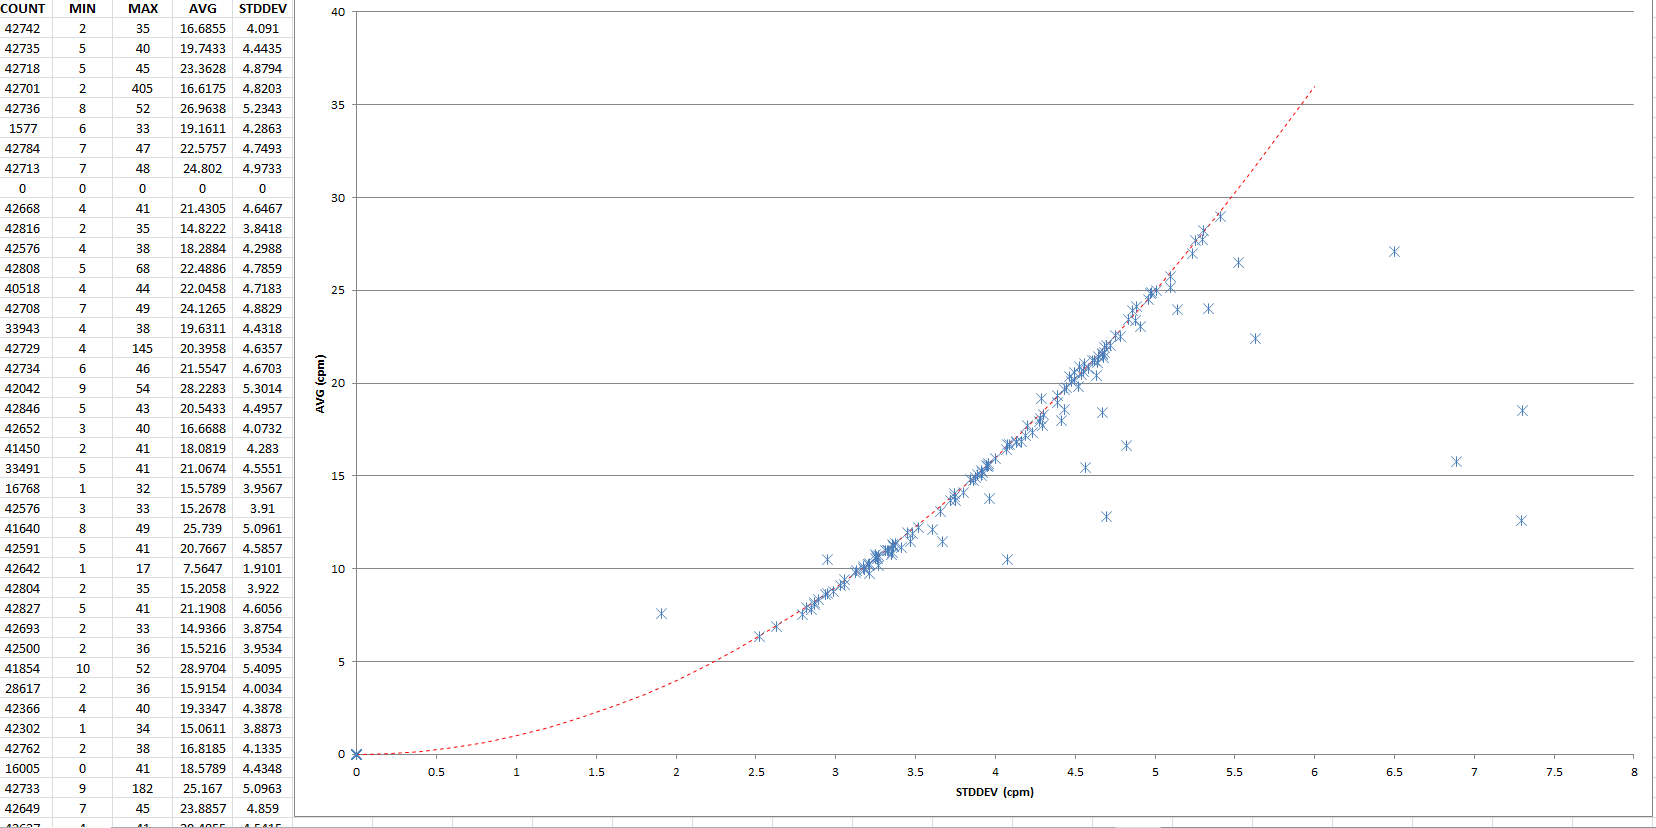
So, for tonight I thought, what clusters will I see if I draw a point for every device in a coord-system:
- Its last-month CPM-StdDev on X-Axis.
- And its last-month CPM-Average on Y-Axis.
I thought I will see clusters off device-types and clusters for things like indoor/outdoor.
But, what the heck? See attachment.
Dear Mathematicians out there, why are there no real clusters; and WHY are nearly all devices on an exact parabola, quadratic equation (red curve is just stddev^2).
Is this correlation a characteristic of natural systems?
It would be fine, because this is what I was looking for, somehow.
If one device leaves the curve during a given period of time, this would indicate manual intervention.
Vinz
I used data of last month:
SELECT
	db_devid,
	COUNT(db_cpm),
	MIN(db_cpm),
	MAX(db_cpm),
	AVG(db_cpm),
	STDDEV(db_cpm)
FROM
	uradmonitor
WHERE
	db_servertime > (UNIX_TIMESTAMP()-30*24*60*60)
GROUP BY
	db_devid;
.