- This topic has 7 replies, 4 voices, and was last updated 11 years ago by .
Viewing 8 posts - 1 through 8 (of 8 total)
- You must be logged in to reply to this topic.
Hi Radu I have a screen grab of the same unit from 18 April and I thought it was a test or unit malfunction but it did settled down soon after .
I’ve also been watching unit 11000089 in Columbus, OH, USA. I think it has some fairly high readings too — but not near as high as Norway.
Greetings all here is some more data from unit 11000038.
Has anyone got any ideas whats going on over there?
I got no reply from the owner of 11000036 for more information.
All other station parameters show normal readings:
temperature:
https://www.uradmonitor.com/data/0.1/public.php?id=11000036¶m=temp1
voltage on tube:
https://www.uradmonitor.com/data/0.1/public.php?id=11000036¶m=vol
duty cycle:
https://www.uradmonitor.com/data/0.1/public.php?id=11000036¶m=duty
Isn’t this an area where Rolls-Royce is building nuclear submarine engines?
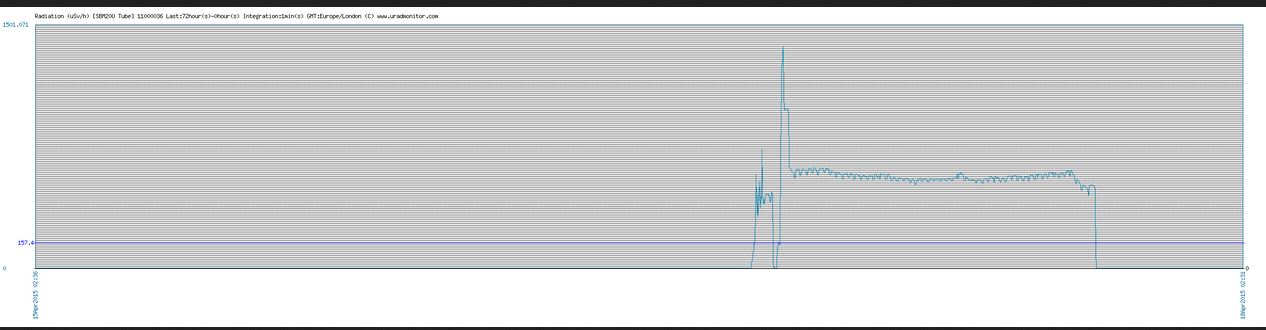
Maybe it is someone who works on a nuclear submarine who measures the radiation of his laundry? It’s not funny i know, these levels can’t be healthy.
I hope the person who set up this monitor can give us some information of what is causing these levels.
Is there a way to add notes nest to the data? or to blocks of data?
Something like selecting a spike and add a note that explains the data.
In the long run then you have a memory of some events that can help to explain other events.
Given that an approximate dose for a chest x-ray is 50 uSv, then with average readings of 7 uSv/hr, that’s like getting a chest x-ray every 8 hours! That can’t be healthy.
I just had a look on Google street view, there seems to be no heavy industry in that area (if it is the correct spot where the monitor is) A few houses and a graveyard a little up the street and a little further a healthcenter. It seems a very nice neighborhood if you don’t mind the radiation levels…