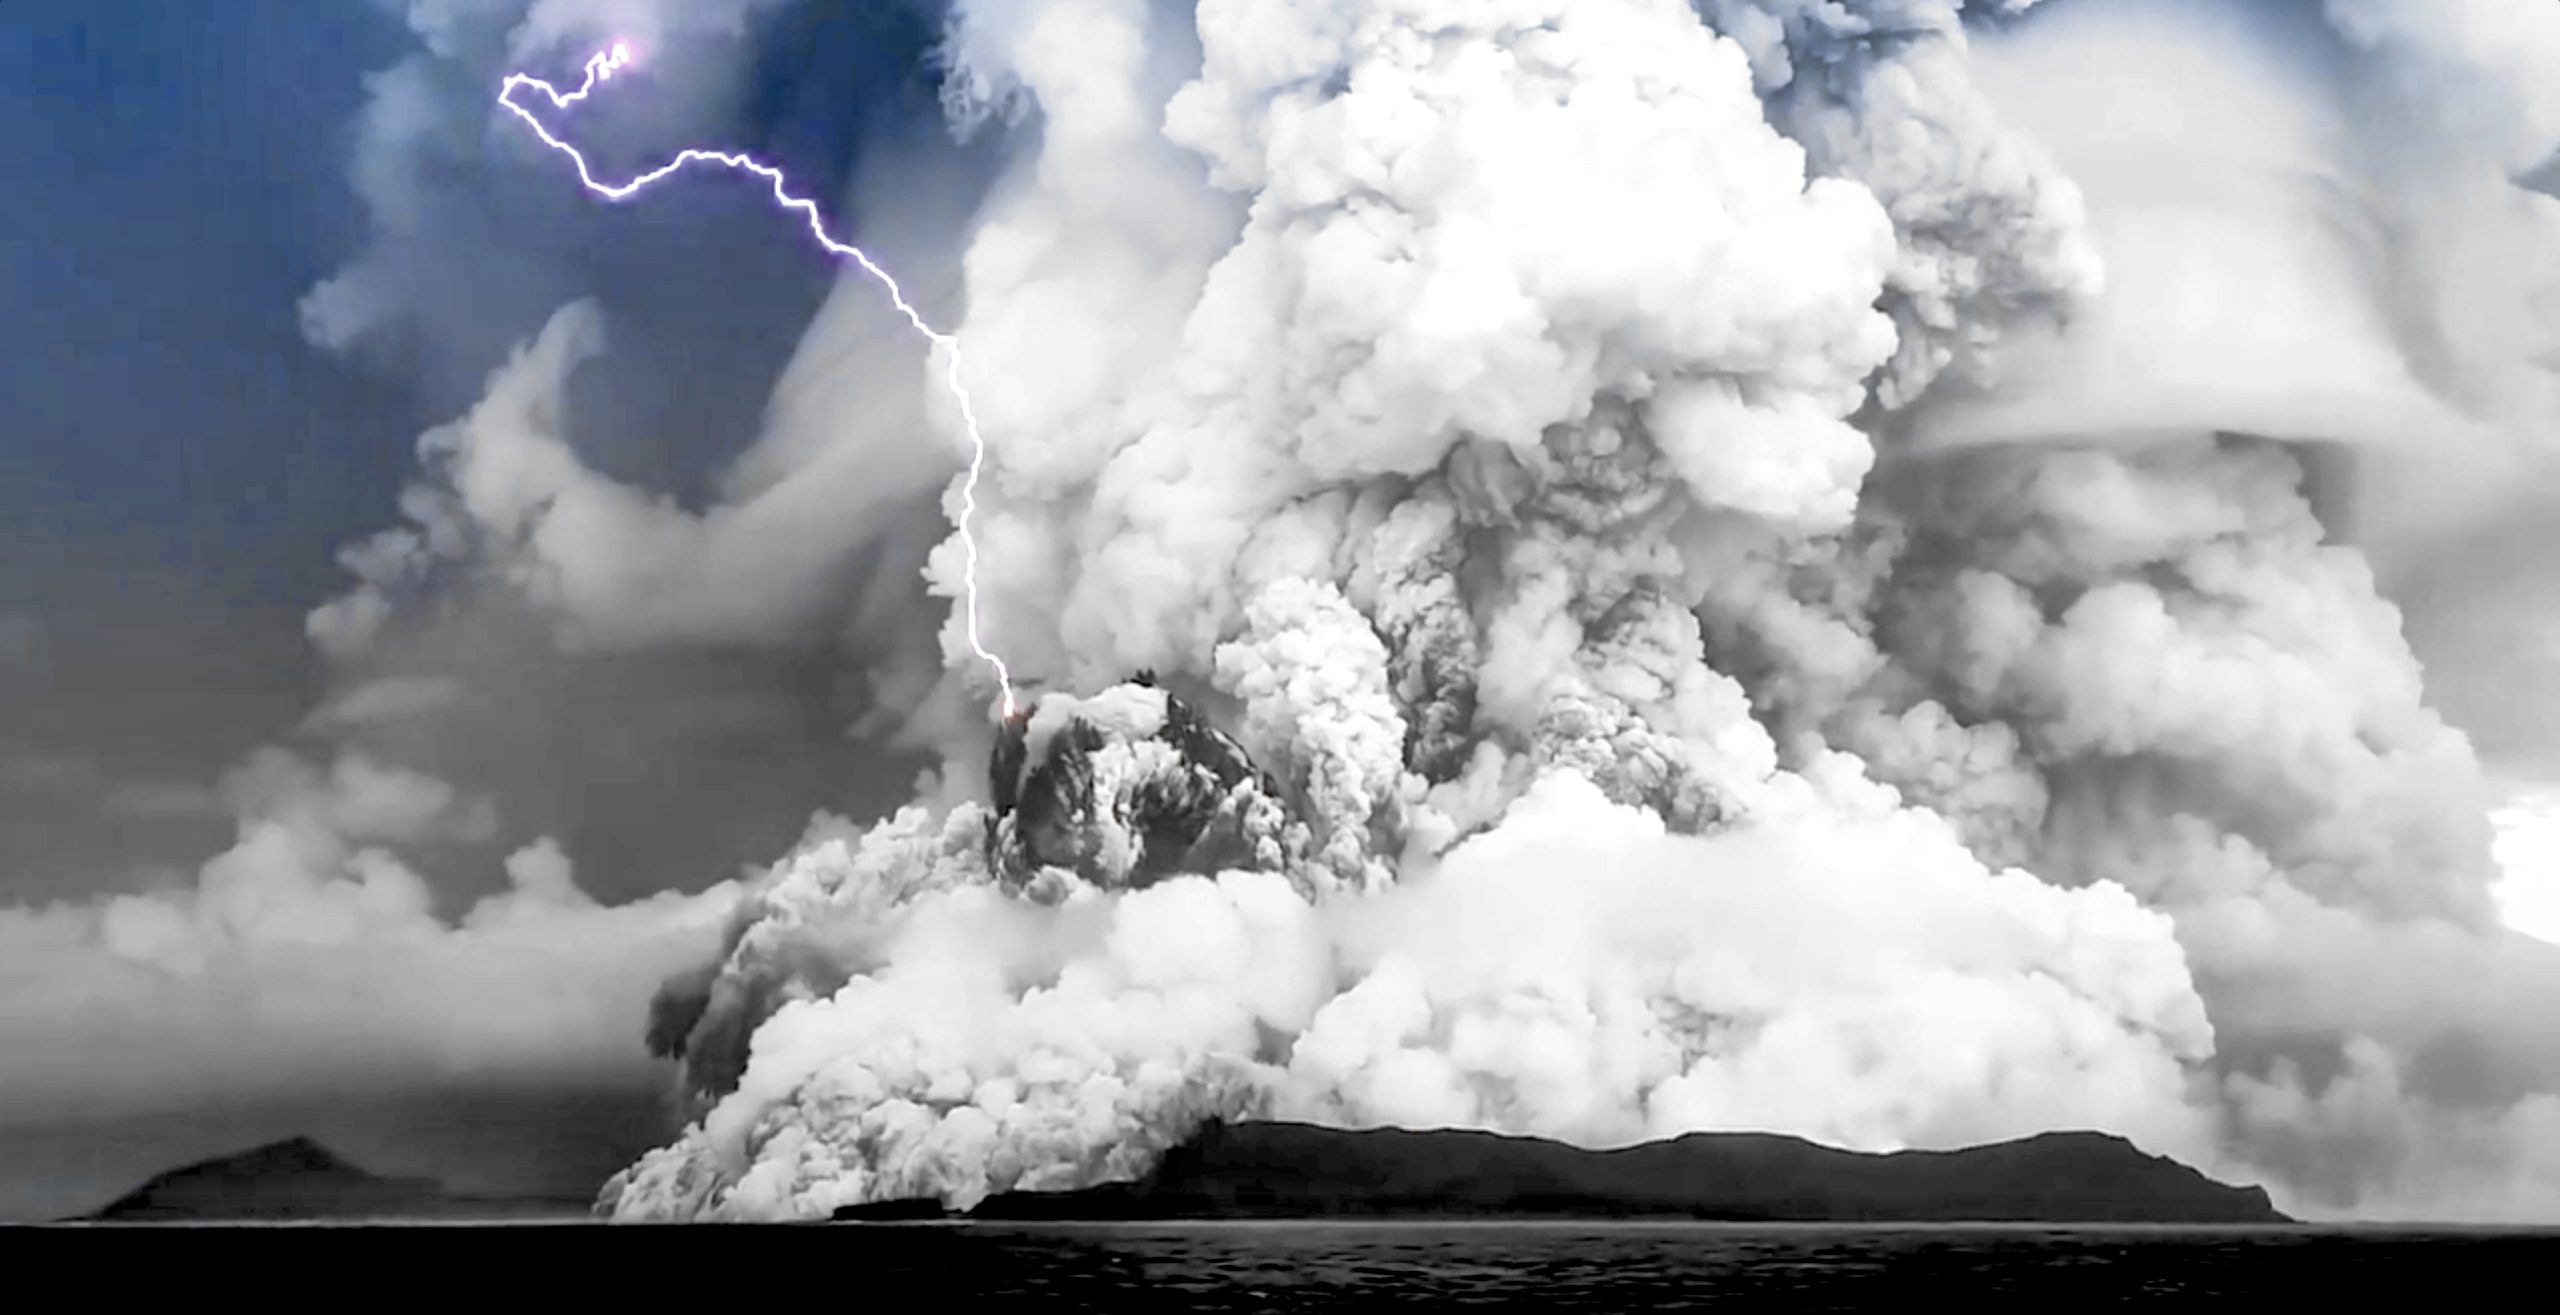
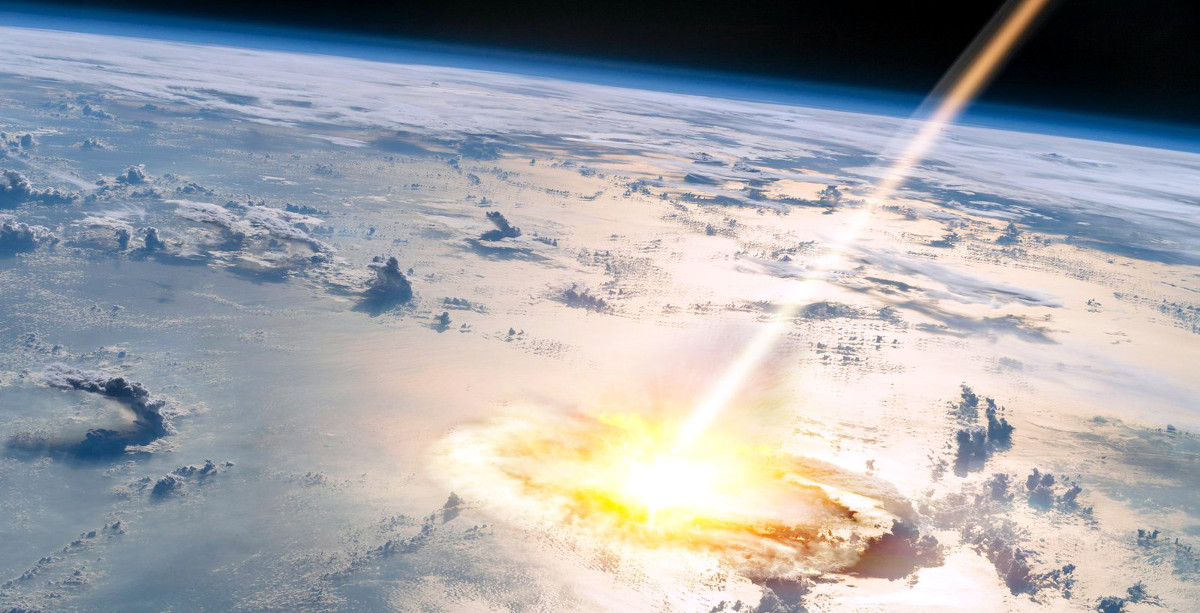
An underwater volcano in the South Pacific erupted violently on Saturday, causing tsunamis on several Pacific coasts. The Hunga-Tonga-Hunga-Ha’apai volcano, about 70 kilometers north of the island of Tonga, Tonga, erupted for the first time on Friday and for the second time on Saturday around 5:26 p.m. local time (GMT+13). Huge clouds formed above the volcano, stretching 20km high and almost 5km wide. Clouds of ash covered the horizon a few moments after the explosion. The powerful explosion could also be seen in satellite images:
The uRADMonitor network has installed thousands of multi-parameter sensors worldwide. From ionising radiation to radon, air pollution or various toxic chemicals, we are adding more features as we go. Measured values include barometric pressure. The explosion produced a strong variation in the barometric air pressure (5mbar in New Zealand) and this was seen on the pressure measurements recorded by the sensors. The shock wave propagated all over the globe and this could be identified on sensors at different distances from the point of explosion. We have compared below the data from 8 sensors out of the over 2500 installed worldwide:
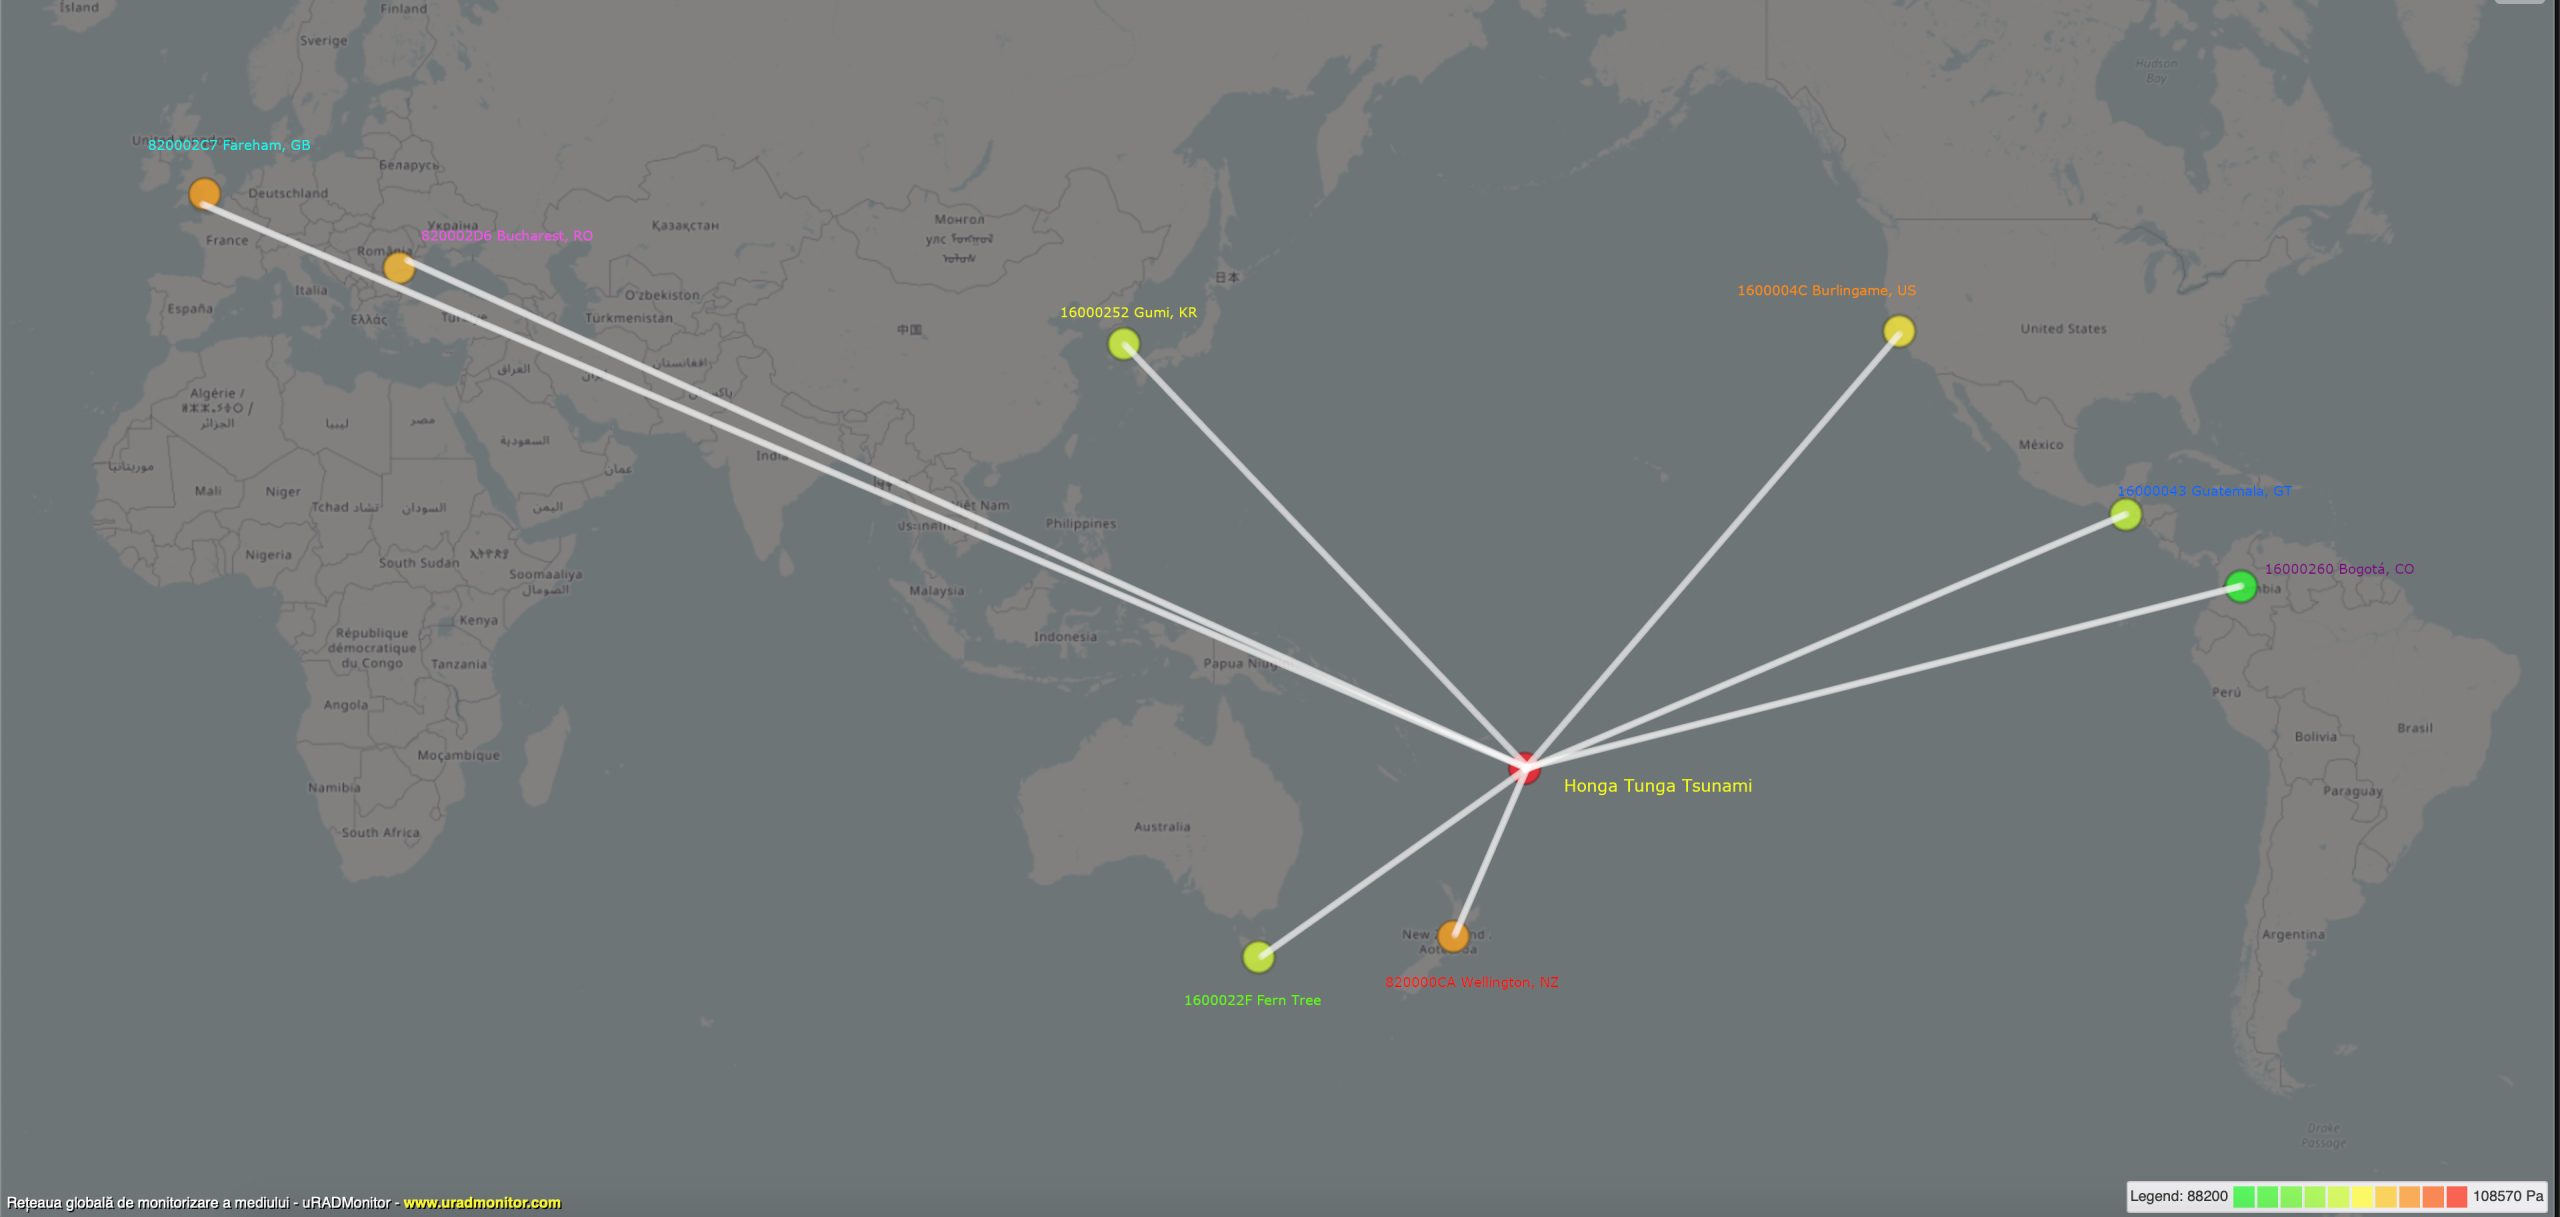
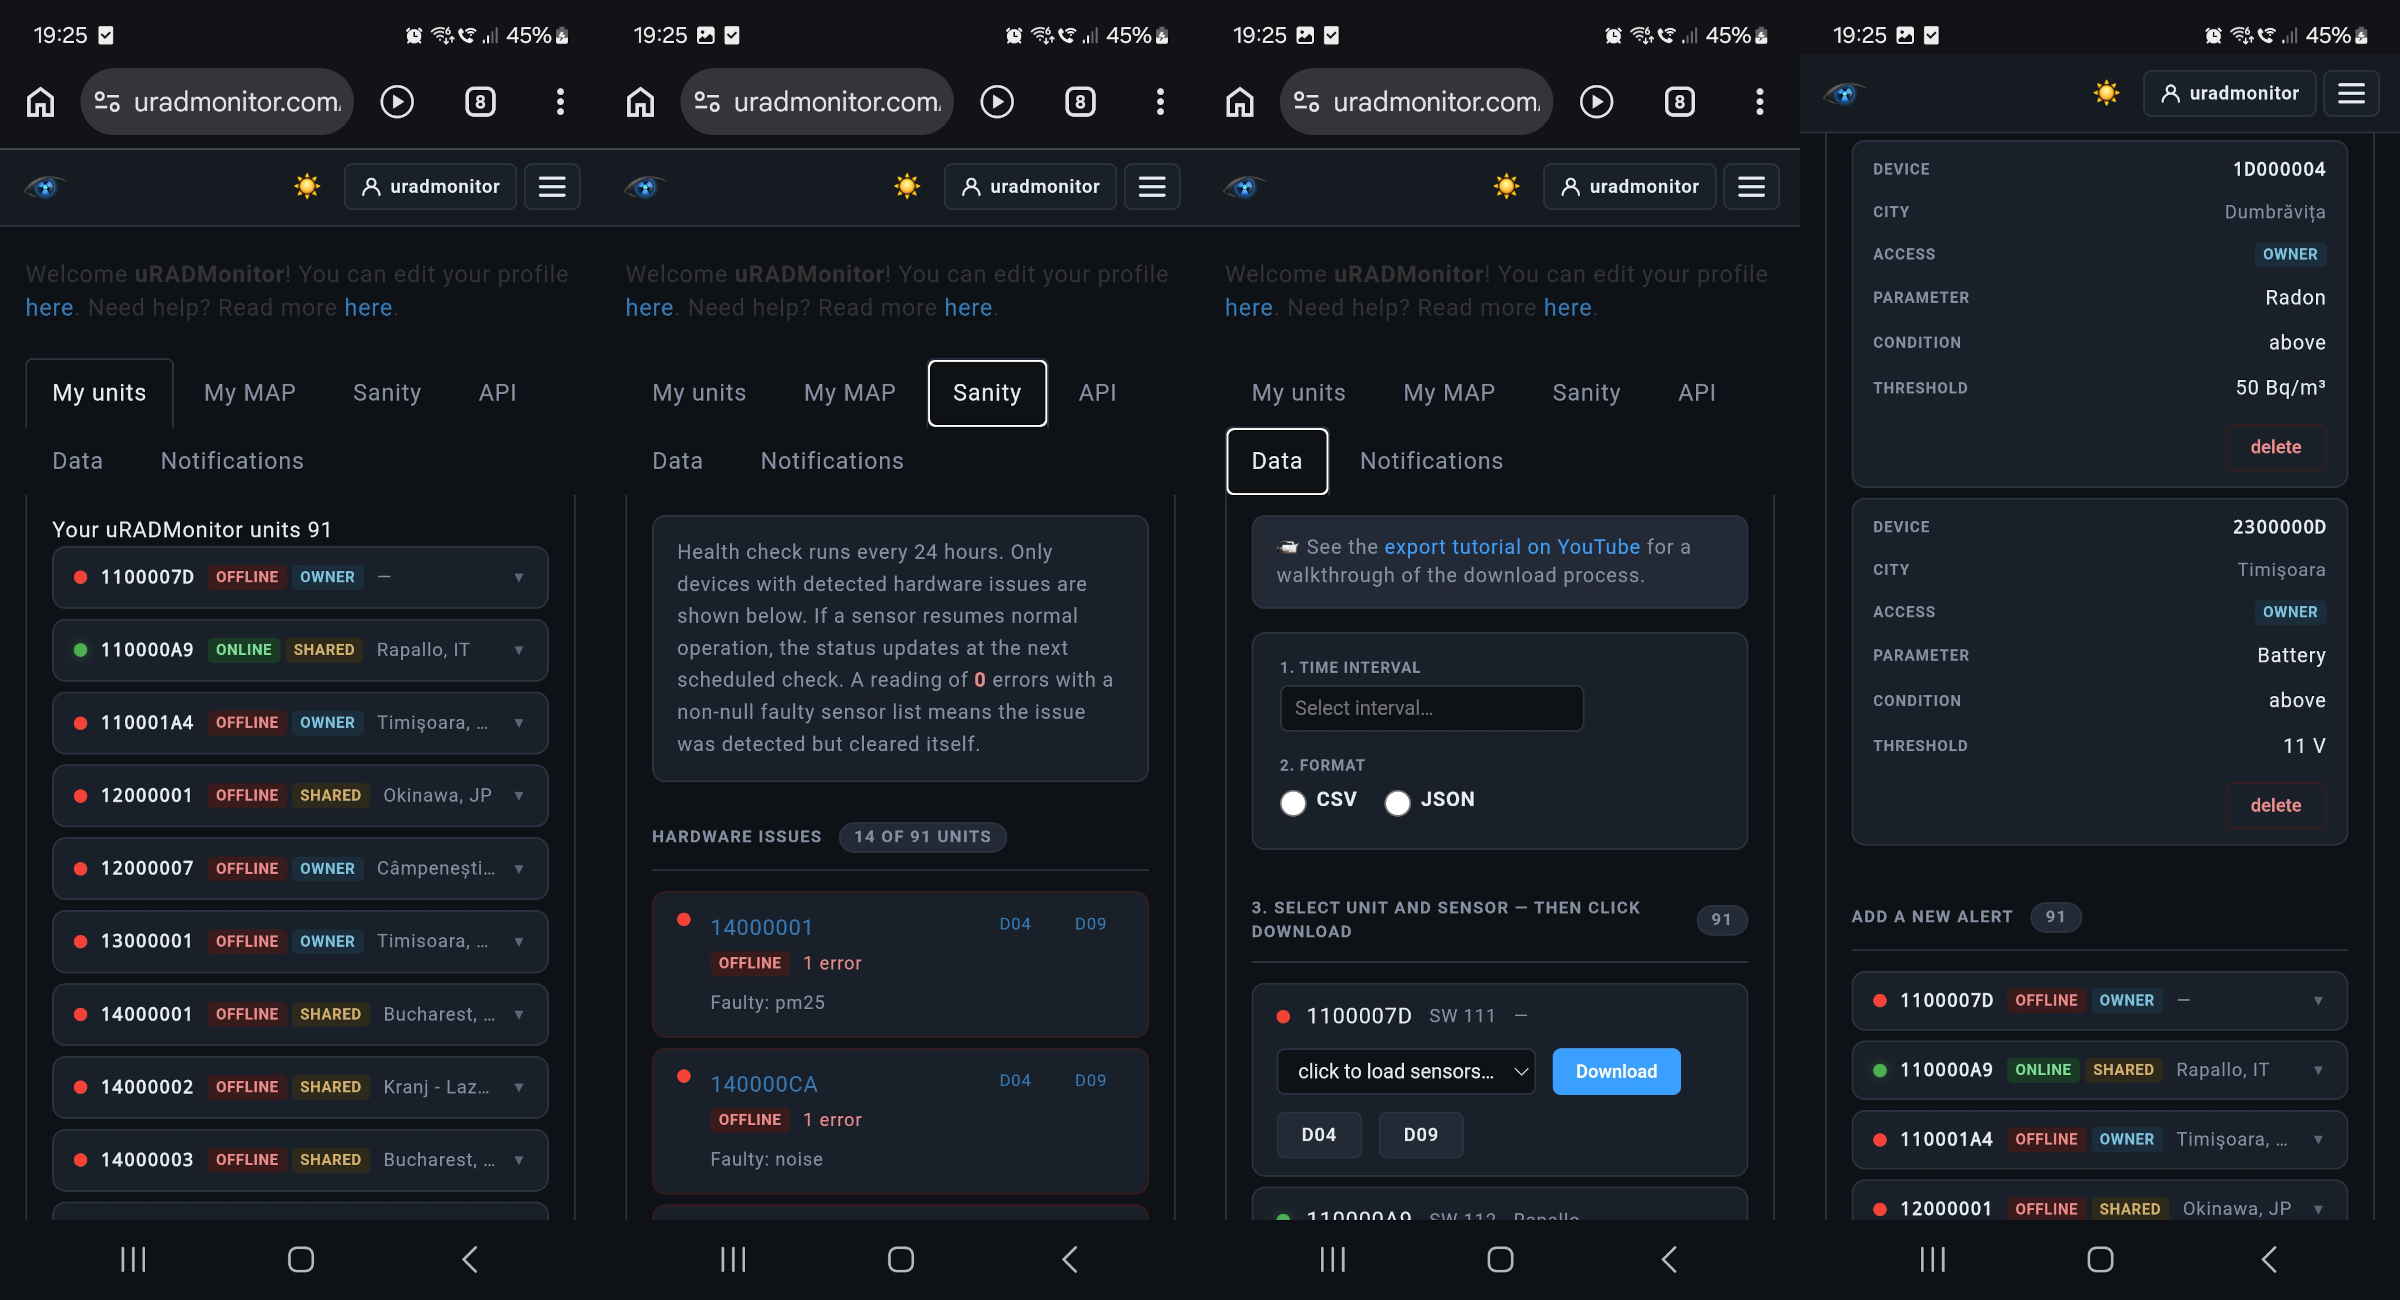
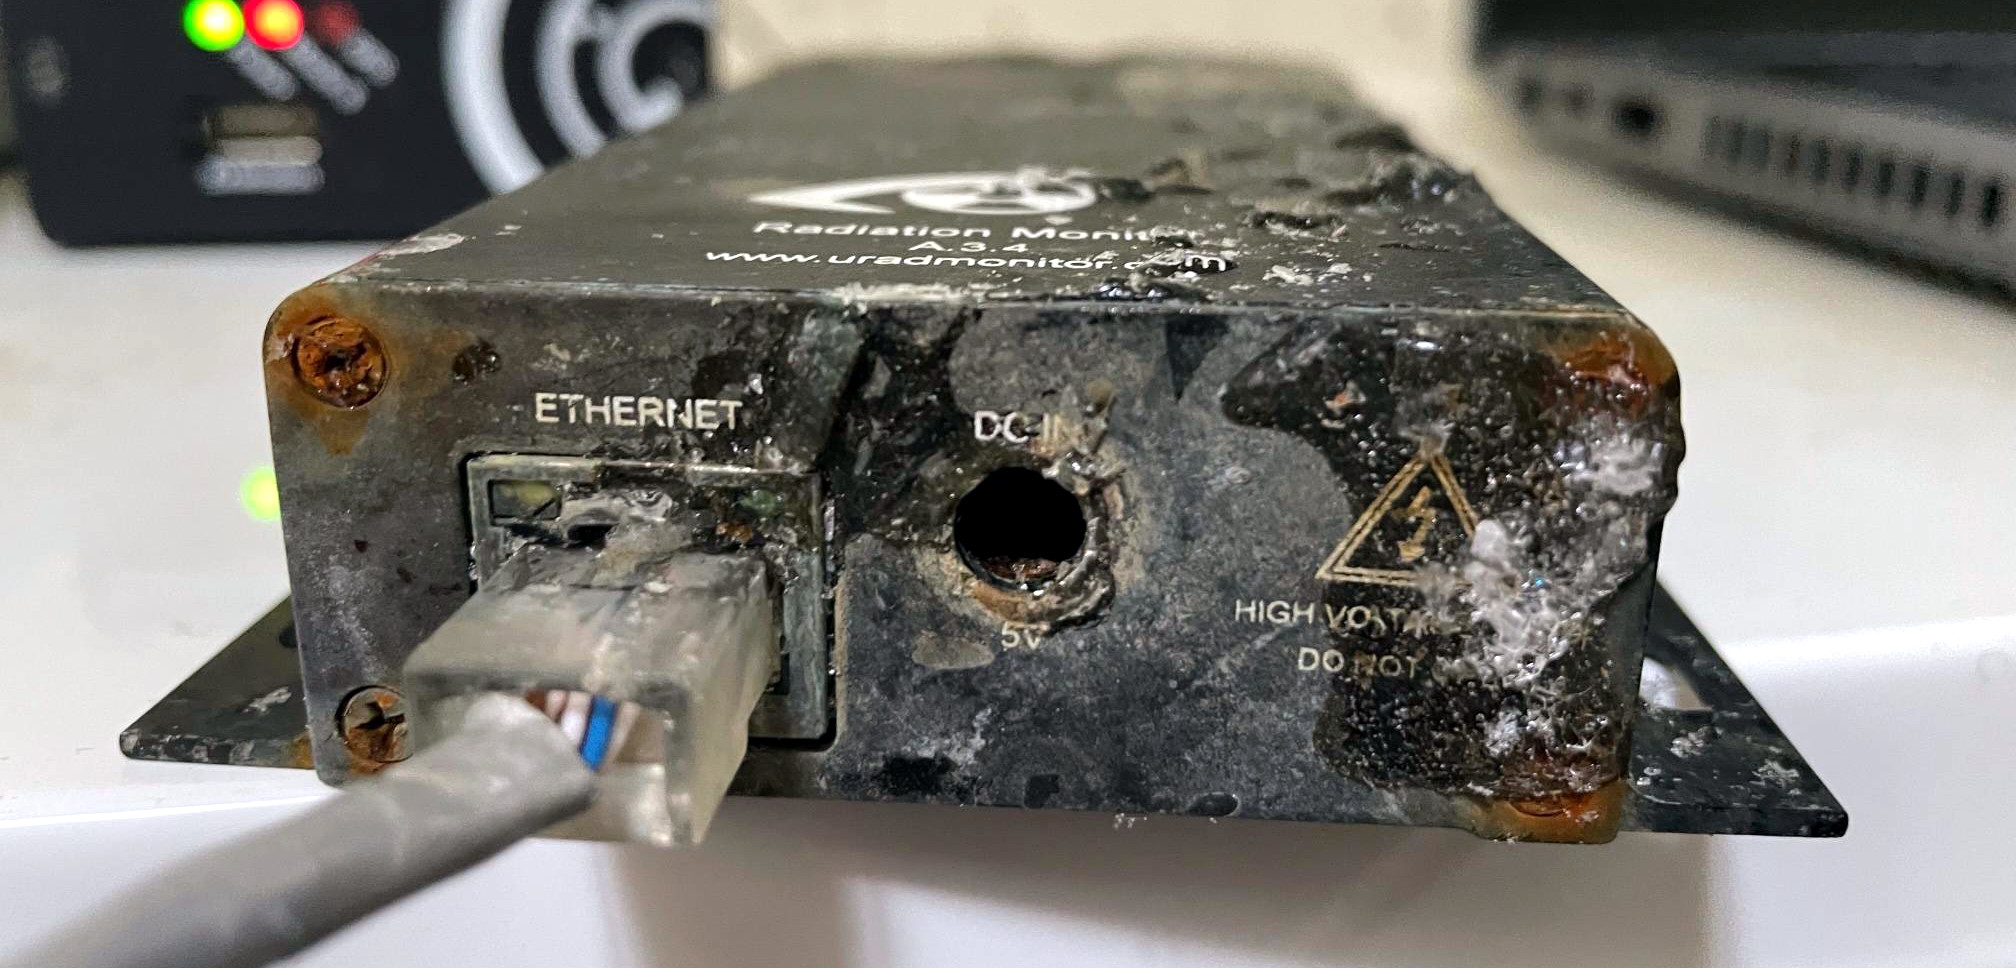
The sensors used are “uRADMonitor SMOGGIE” and “uRADMonitor A3”, installed in several locations: New Zealand, Australia, South Korea, USA, Guatemala, Colombia, UK and Romania. The sensors are of Romanian design and were manufactured in Timișoara by the company Magnasci SRL.
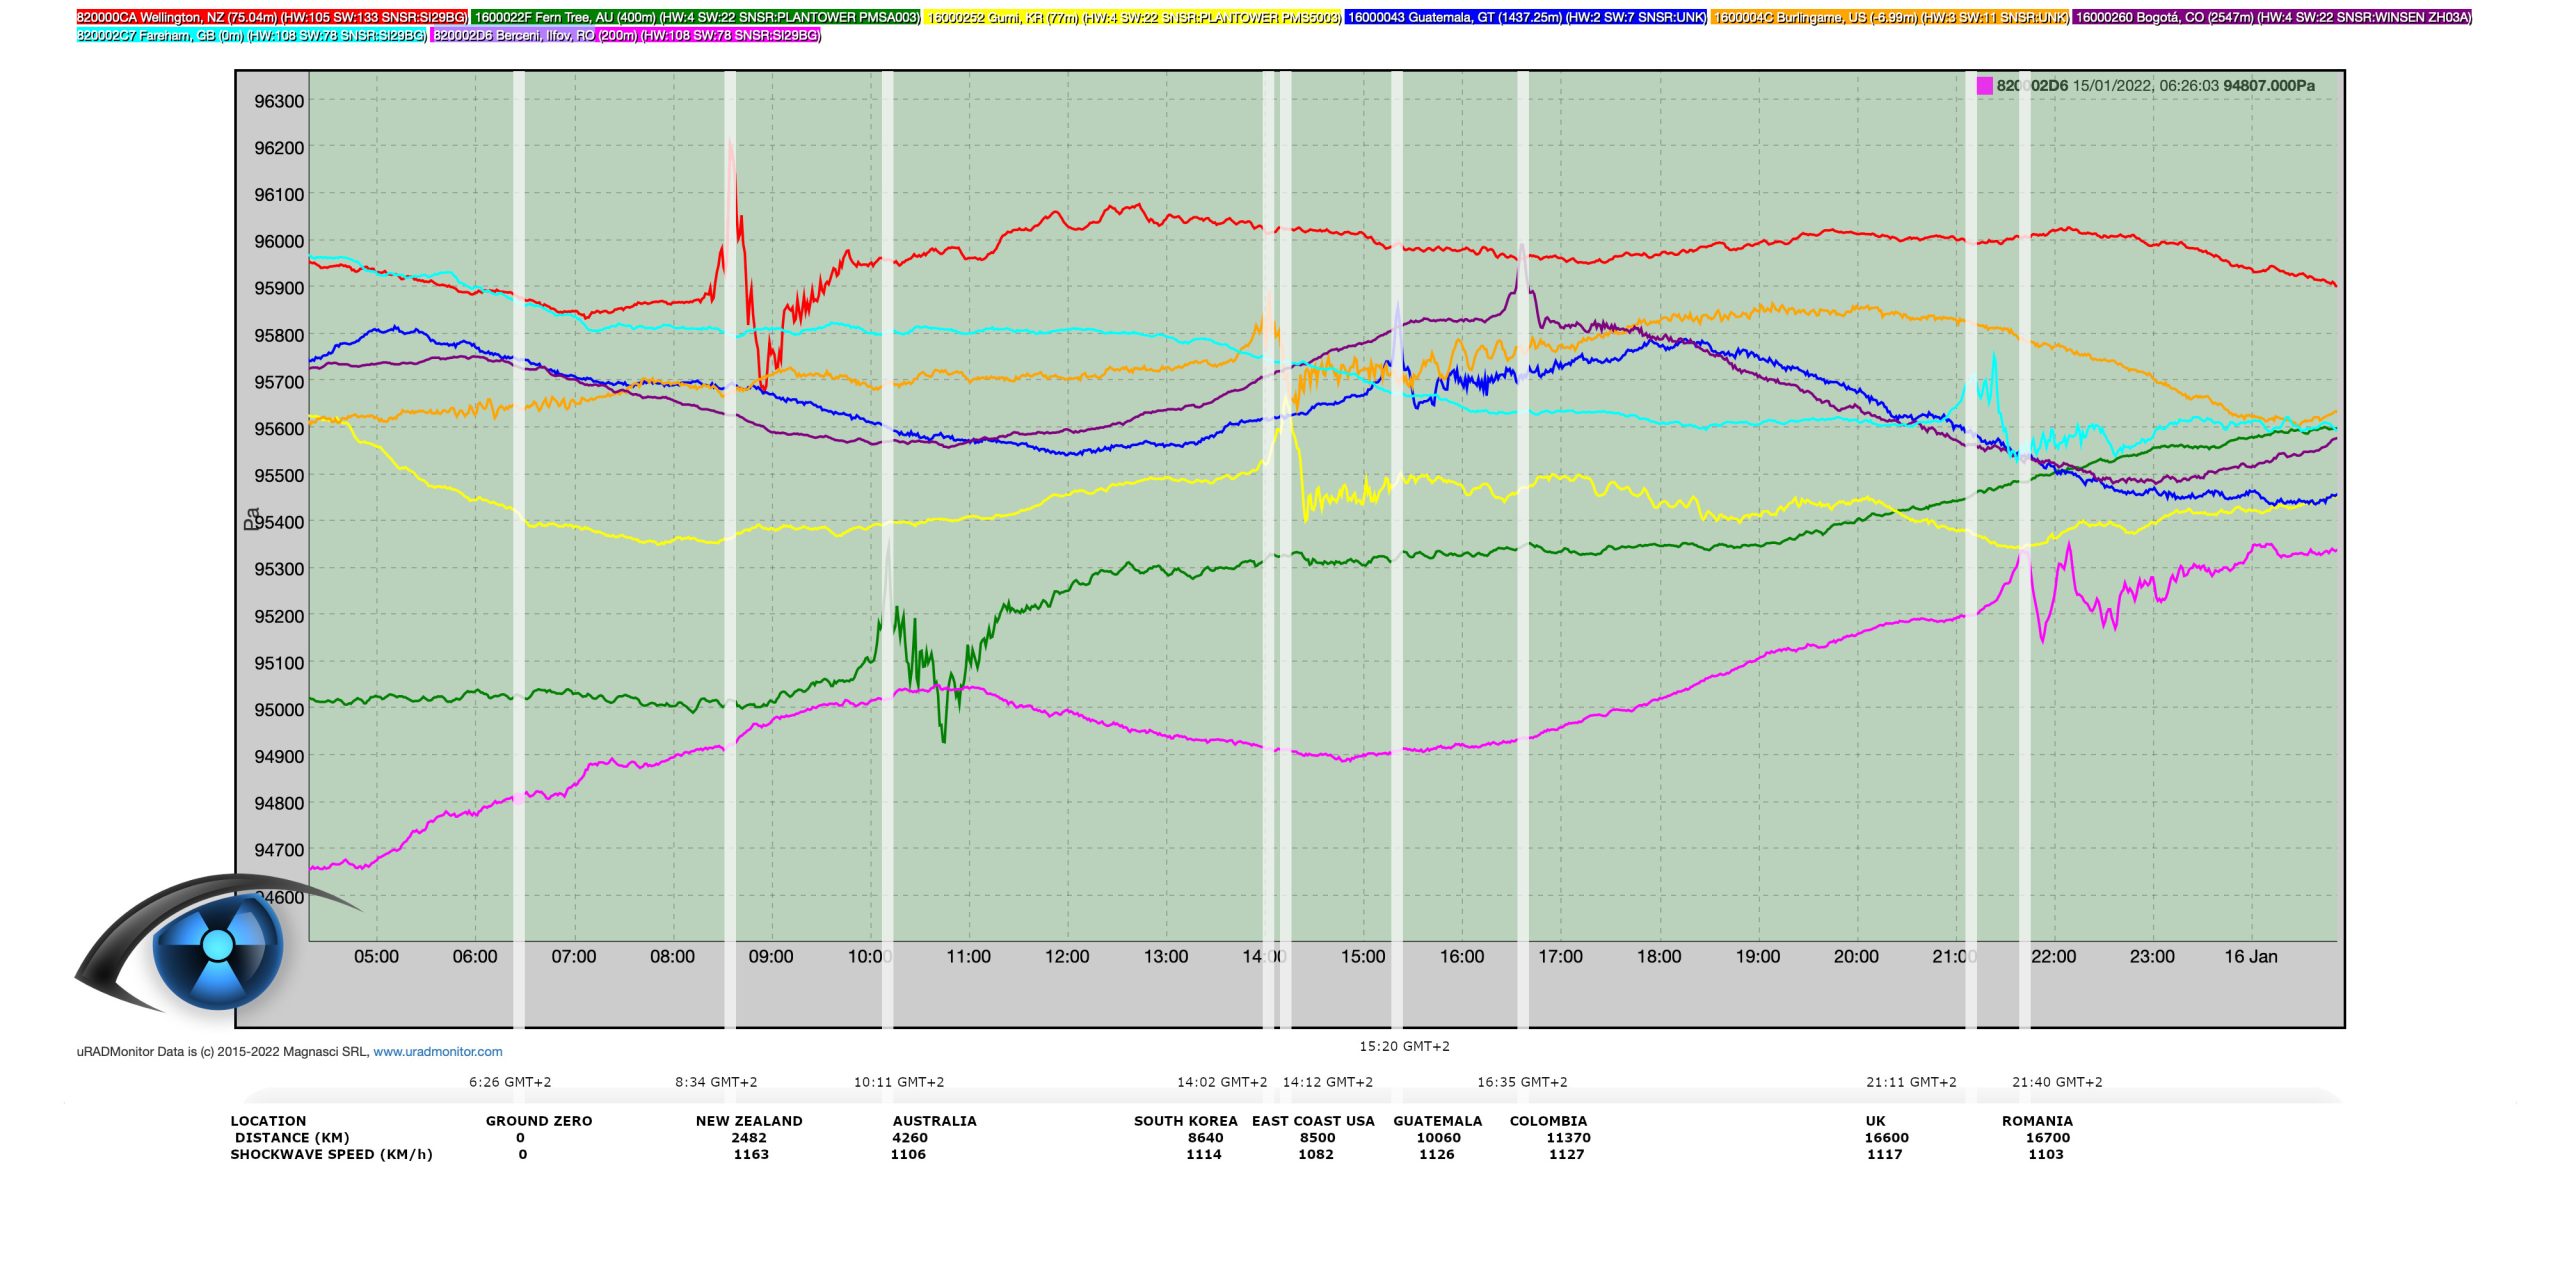
The sensors recorded the moment when the shock wave arrives. This is manifested by a characteristic oscillation, marked above by the white lines. This way we can calculate the time it took for the wave to reach the sensors. Knowing the distance from zero point to each sensor, we can calculate the speed of the shock wave. Calculations show that the wave traveled around the globe at a speed of about 683mph (1100km/h), a consistent value for the 8 sensors. The explosion was felt not only on the Pacific coast (San Francisco USA, South Korea, etc.) but also in the continental areas – as an example the sensors from Great Britain and Romania illustrated in the image above.
Countries at greater distance from the event recorded the arrival of two shock waves from the opposite sites of the Globe (In Romania second wave arrived 5 hours later, coming from the North-East).
To put these figures in perspective, it is estimated that the impact that led to the extinsion of dinosaurs generated a shockwave that has a speed of 44700mph (or 72000km/h). On the other hand, the biggest nuclear weapon detonated in the atmosphere, the Tzar Bomba, generated a pressure wave the traveled with a speed of 677mph (1090km/h) – very similar to what we saw now.
This is one example on how such a network of sensors allows us to make determinations in the case of global events. It is possible to determine precisely the location and magnitude of a major explosion and its propagation around the globe, triangulation being easy by the large number of sensors installed. Being multi-parameter sensors allow us to draw indirect conclusions about a wide range of incidents related to physical or chemical phenomena with a direct impact on us and the environment.
codemore code
~~~~