I’m Moz and I live in Sydney, Australia. I’ve participated in a range of citizen science initiatives, from counting urban wildlife to counting bicycle commuters, and I’d previously tried to join another climate monitoring project but sadly could never get their hardware to work. I found Radu’s first A3 units via Indiegogo and bought two so I could monitor air quality inside and outside my house. I was concerned about particulates from a nearby major road as well as CO2 levels inside the house. Being able to see inside and outside temperatures online was a useful secondary benefit.
This summer the climate catastrophe has made the bushfires especially bad. NSW normally has a bushfire season that starts in late December and runs through to the start of the rains sometime in March. This year the season started 4-6 weeks early and the forecast is for it not to end until late April. The previous worst fire season was in 1938-1939 and that burned five million hectares over four months. This season we have already lost five million hectares in the first two months. You may have seen maps showing fires all over Australia, but this graph of number of fires detected by NASA comparing this year to recent years shows just how dramatically awful this year has been.

Australia has set a lot of new records, mostly highest temperatures (it was 50°C at my house!) but also bushfire area burnt and number of fires active at a time. I live in the middle of a major city (4.5 million people) and not near the bush, but sadly the whole city has been covered in smoke and ash from the fires. Our air pollution has been higher than in cities that are world famous for having awful air quality.
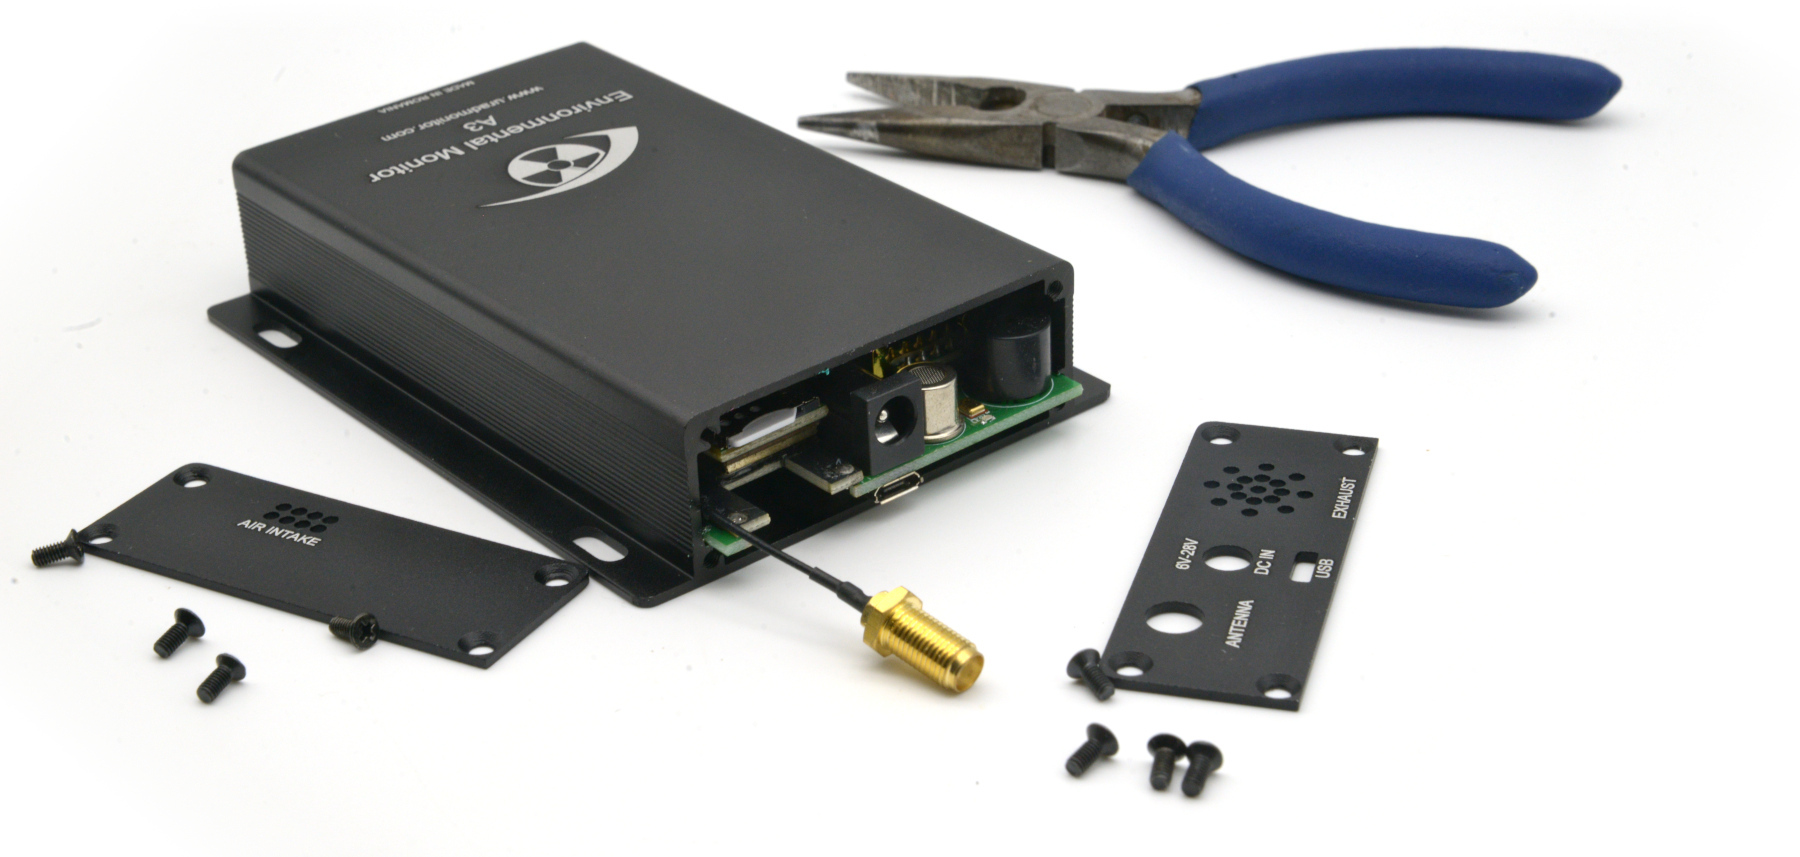
The particulate sensors Radu uses measure PM1, PM2.5 and PM 10, and the safe limit for any of those is about 50µg/m³. Parts of NSW have seen levels over 2500µg/m³ when averaged over 24 hours. The sensors in the uRadMonitor only go up to 1000µg/m³! But the advantage of the laser sensors is that they respond very quickly – the graphs on the uradmonitor website show spikes in local particulates on a minute by minute basis, where the gravimetric sensors used by the government respond much more slowly. I have persuaded friends to buy Smoggie units, and they show that pollution spikes across the city at different times.


The uRadMonitors mean that I can see the current pollution levels at home and at work, so I can decide when to commute as well as which mask to wear. I can also compare my measurements to the official ones because those are a 24 hour rolling average, and while they’re more accurate the averaging doesn’t tell me what conditions are like right now.
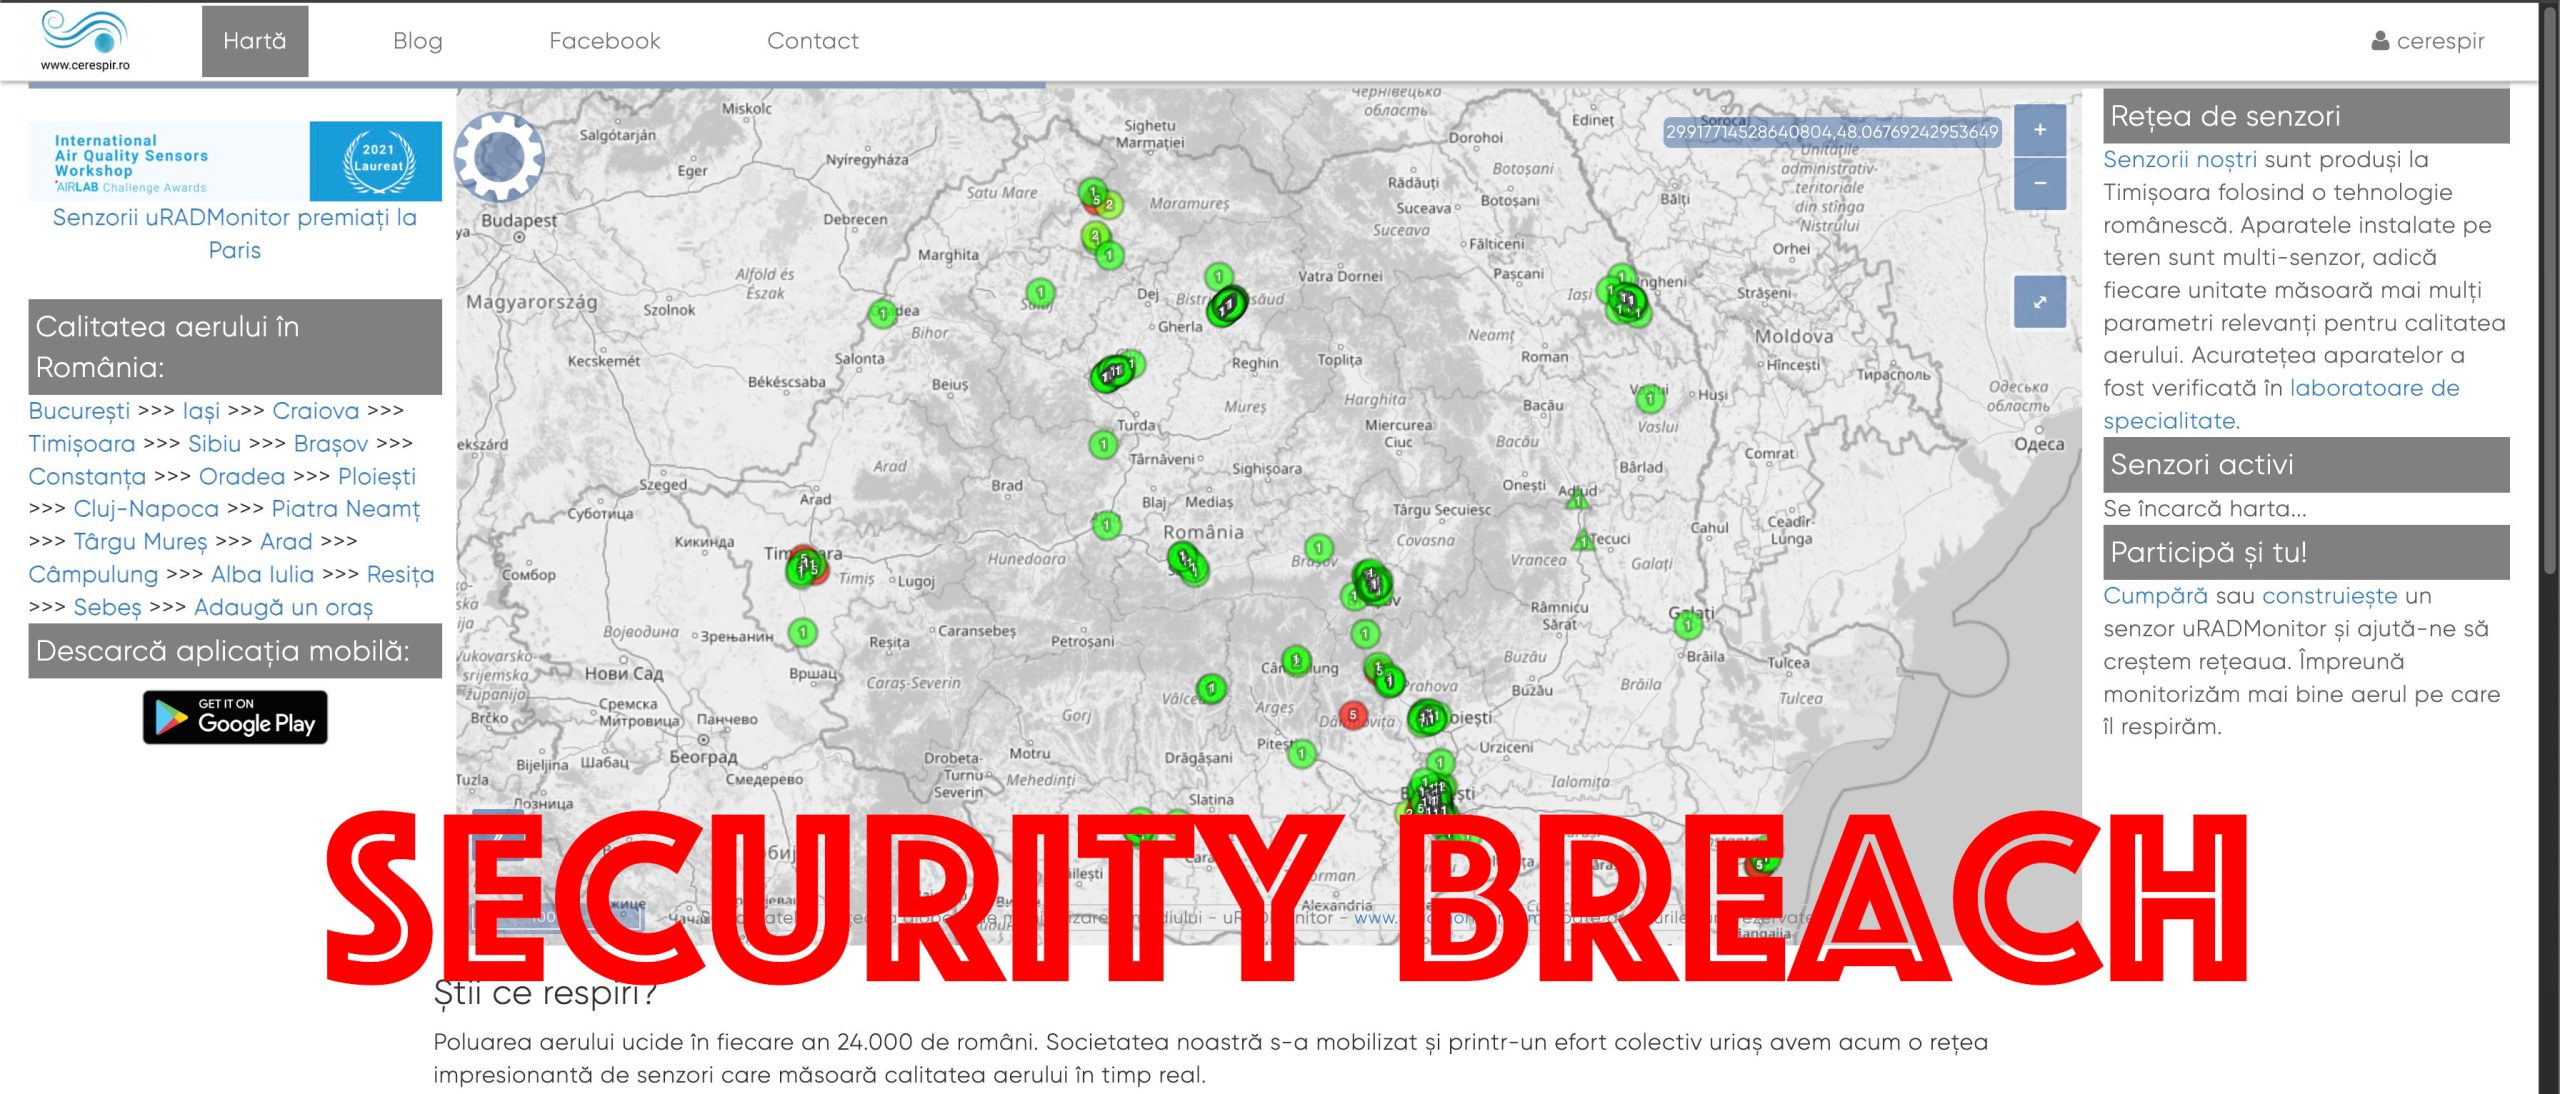
Once I had the first units working my coworkers started watching the website, and a few friends were slightly interested. But with the fires this year people are a lot more interested. Especially when I’m out on high-pollution days people have been very interested, and having the cheaper Smoggie unit available helps a lot when I suggest they buy a monitor themselves. One result is that I ordered three Smoggies on behalf of friends. Those are still linked to my account: https://www.uradmonitor.com/users/moz1/ (note that 82000090 is inside my house)
- What we can do about the fires https://theconversation.com/in-fact-theres-plenty-we-can-do-to-make-future-fires-less-likely-129341
- The fires really are unprecedented: https://www.theguardian.com/australia-news/2019/nov/22/australia-bushfires-factcheck-are-this-years-fires-unprecedented
- A good overview of the scale of the fires: https://theconversation.com/some-say-weve-seen-bushfires-worse-than-this-before-but-theyre-ignoring-a-few-key-facts-129391
- Australian politics is struggling to deal with the ongoing crisis: https://theconversation.com/scott-morrisons-biggest-failure-in-the-bushfire-crisis-an-inability-to-deliver-collective-action-129437
- One personal story: https://nofibs.com.au/diary-of-an-orbost-climate-refugee-greengipps-reports-on-australianbushfires/ “I think about Australia’s climate policy. How is it we’re too small to help but we’re not too small to consistently sabotage every international climate talk? Is there any other area of life where we say our contribution is small so we shouldn’t have to do anything”
A more upbeat video from Greta and Georage: https://youtu.be/aUCD_24cygQ
I live in the middle of Chatswood and it’s a bit like a mini CBD, so I’ve been interested in monitoring Air Quality for a while, but it’s not until the recent fires that I decided to purchase a Smoggie unit. It’s been great to measure the real time Air Quality since like you said, the government only reports PM2.5 as a 1 hour average in NSW. This has been a great source of confusion for many people trying to track Air Quality in Sydney due to the unprecedented bushfires. The delay due to 24 hour averaging can mean that the NSW EPA is reporting Good quality air when it is actually Hazardous, and also reporting Hazardous air quality when it’s actually Good. Having Smoggie makes a big difference for monitoring and responding to the actual conditions outside in real time.