Richard Prettyman, August 2014
Background
A close correlation between gamma count rate at ground level, and soil derived Rn-222 flux has been demonstrated in work which has also studied the effects of meteorological and diurnal factors on Rn out-gassing and hence gamma count rate (Szegvary et al, 2007). Under conditions of settled weather with no precipitation it has been observed that there is a diurnal cycle in gamma ray count rate with maxima around sunrise presumed due to accumulation of Rn and Rn progeny in near-surface air overnight (Greenfield et al, 2002).
There is little or no description in the scientific literature of whether indoor gamma count rates exhibit the same cyclical variations. The current indoor installation of the uRad Monitor radiation detector #1200000C provided an opportunity to investigate this.
Methods
Detector – uRad Monitor (Motisan R, 2014) is a network of GM-based ionising radiation detectors located currently in Europe, North America, Australia, New Zealand and Japan. uRad Monitor #1200000C is a SI29BG-based detector in an aluminium housing which responds predominantly although not exclusively to gamma radiation. Count rate data is recorded and transmitted continuously via built in Ethernet adapter to the server of the uRad Monitor network.
Setting – Detector #1200000C is currently located at my home in Leicestershire, UK (52.60, -1.07; 90m elevation). It is on a table top 0.6m from the floor in a ground floor room that is well ventilated. Flooring is carpet over wooden boards and the void under the floor is in communication with outside air via structural vents.
Data collection, analysis and presentation – Count-rate data were extracted from the server on execution of the following php command on 2014-08-07:
http://uradmonitor.com/data/0.1/export.php?id=1200000C¶m=cpm&start=480&stop=0&integration=1&gmt=Europe/London
Count rate data were returned in the form of a CSV file containing 1-minute resolution data from 2014-07-19 to 2014-08-07. These data were imported into an Excel spreadsheet for further manipulation and analysis.
The raw 1minute data were subjected to two levels of smoothing using a simple moving average (SMA) function with 60 minute and 100 minute periods. The 60 minute SMA was calculated by a function averaging the 30 data points before and 30 points after the index point. The 100 minute SMA was calculated as the average of 50 points either side of the index point. The moving average provides an effect in the time domain that is equivalent to a low pass filter in the frequency domain.
For each of the 1440 minutes in the day, corresponding 1-minute data points were averaged across an 18 day period commencing 2014-07-19. This composite data series was presented as a line graph.
Meteorological data (including temperature, humidity, barometric pressure and rainfall) for the locality of the observations was available from a WH1080-type weather station. The external sensor for this is located 20m away from the nearest building at a height of approximately 3m above the ground.
Results
The 18+ day period starting 19th July was dominated by high pressure and settled weather conditions for much of the time at the location of the experiment although weather fronts associated with some rainfall occurred at the beginning and end of the period. Day time temperature maxima were in the range 22-32 deg Celsius (see figures 1-4 below). There was negligible precipitation. GM tube voltage as read out from the device was nominally stable over the 18 day period varying between 380v and 384v.


Internal temperature read out from the device showed a cyclical variation reflecting the diurnal cycle of indoor ambient temperature at this location.
On visual inspection (see figure 5 below) there was no obviously discernible regular diurnal fluctuation in count rate and no clear longer-term fluctuations that might reflect changing atmospheric conditions such as pressure changes.

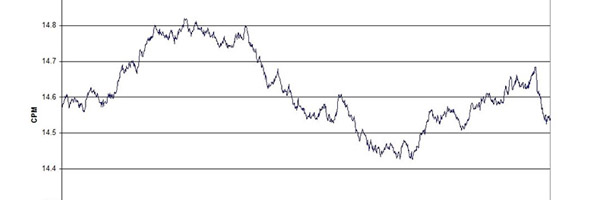
The combined smoothed minute to minute data are presented in figure 6 below. When processed in this way, a modest cyclical variation over the 24 hour period is seen with minimum count rate of 14.45 cpm being seen at c16.00 hrs and maximum of 14.80 cpm at c06.00 hrs.

Conclusion and comment
* A small magnitude diurnal fluctuation in gamma count rate was observed in the 18-day aggregated data although this was hard to spot day to day in the raw data. This seems broadly in line with published data for outdoor observations.
* An obvious limitation to the interpretation of this data is that the absolute magnitude of the diurnal variation in count rate is small (range approx 0.45 cpm) compared with the standard deviation for the data c 0.3 cpm) so the findings may not be statistically significant.
* Replication of the experiment with a longer period of observation will reduce the dispersion in the data and allow for more confident interpretation.
References
* Greenfield, M. B.; Domondon, A. T.; Okamoto, N.; Watanabe, I.
Journal of Applied Physics, Volume 91, Issue 3, pp. 1628-1633, 2002 (abstract accessed as http://scitation.aip.org/content/aip/journal/jap/91/3/10.1063/1.1426248)
* Motisan R https://www.uradmonitor.com/ 2014
* Szegvary, T., Leuenberger, M. C., and Conen, F.: Predicting terrestrial 222Rn flux using gamma dose rate as a proxy, Atmos. Chem. Phys., 7, 2789-2795, doi:10.5194/acp-7-2789-2007, 2007 (full text accessed as http://www.atmos-chem- phys.net/7/2789/2007/acp-7-2789-2007.pdf)
The article as PDF is available here: observations on diurnal indoor variations in gamma ray count rates v1.1.


codemore code
~~~~