I am a researcher working on topics related to aerosol composition and dynamics, in particular the measurement and analysis of PM2.5 and PM10 in urban environments. In my work I have been using data from uRADMonitor devices to obtain a better understanding of air quality in Romanian cities.
Low-cost sensors vs. reference grade equipment
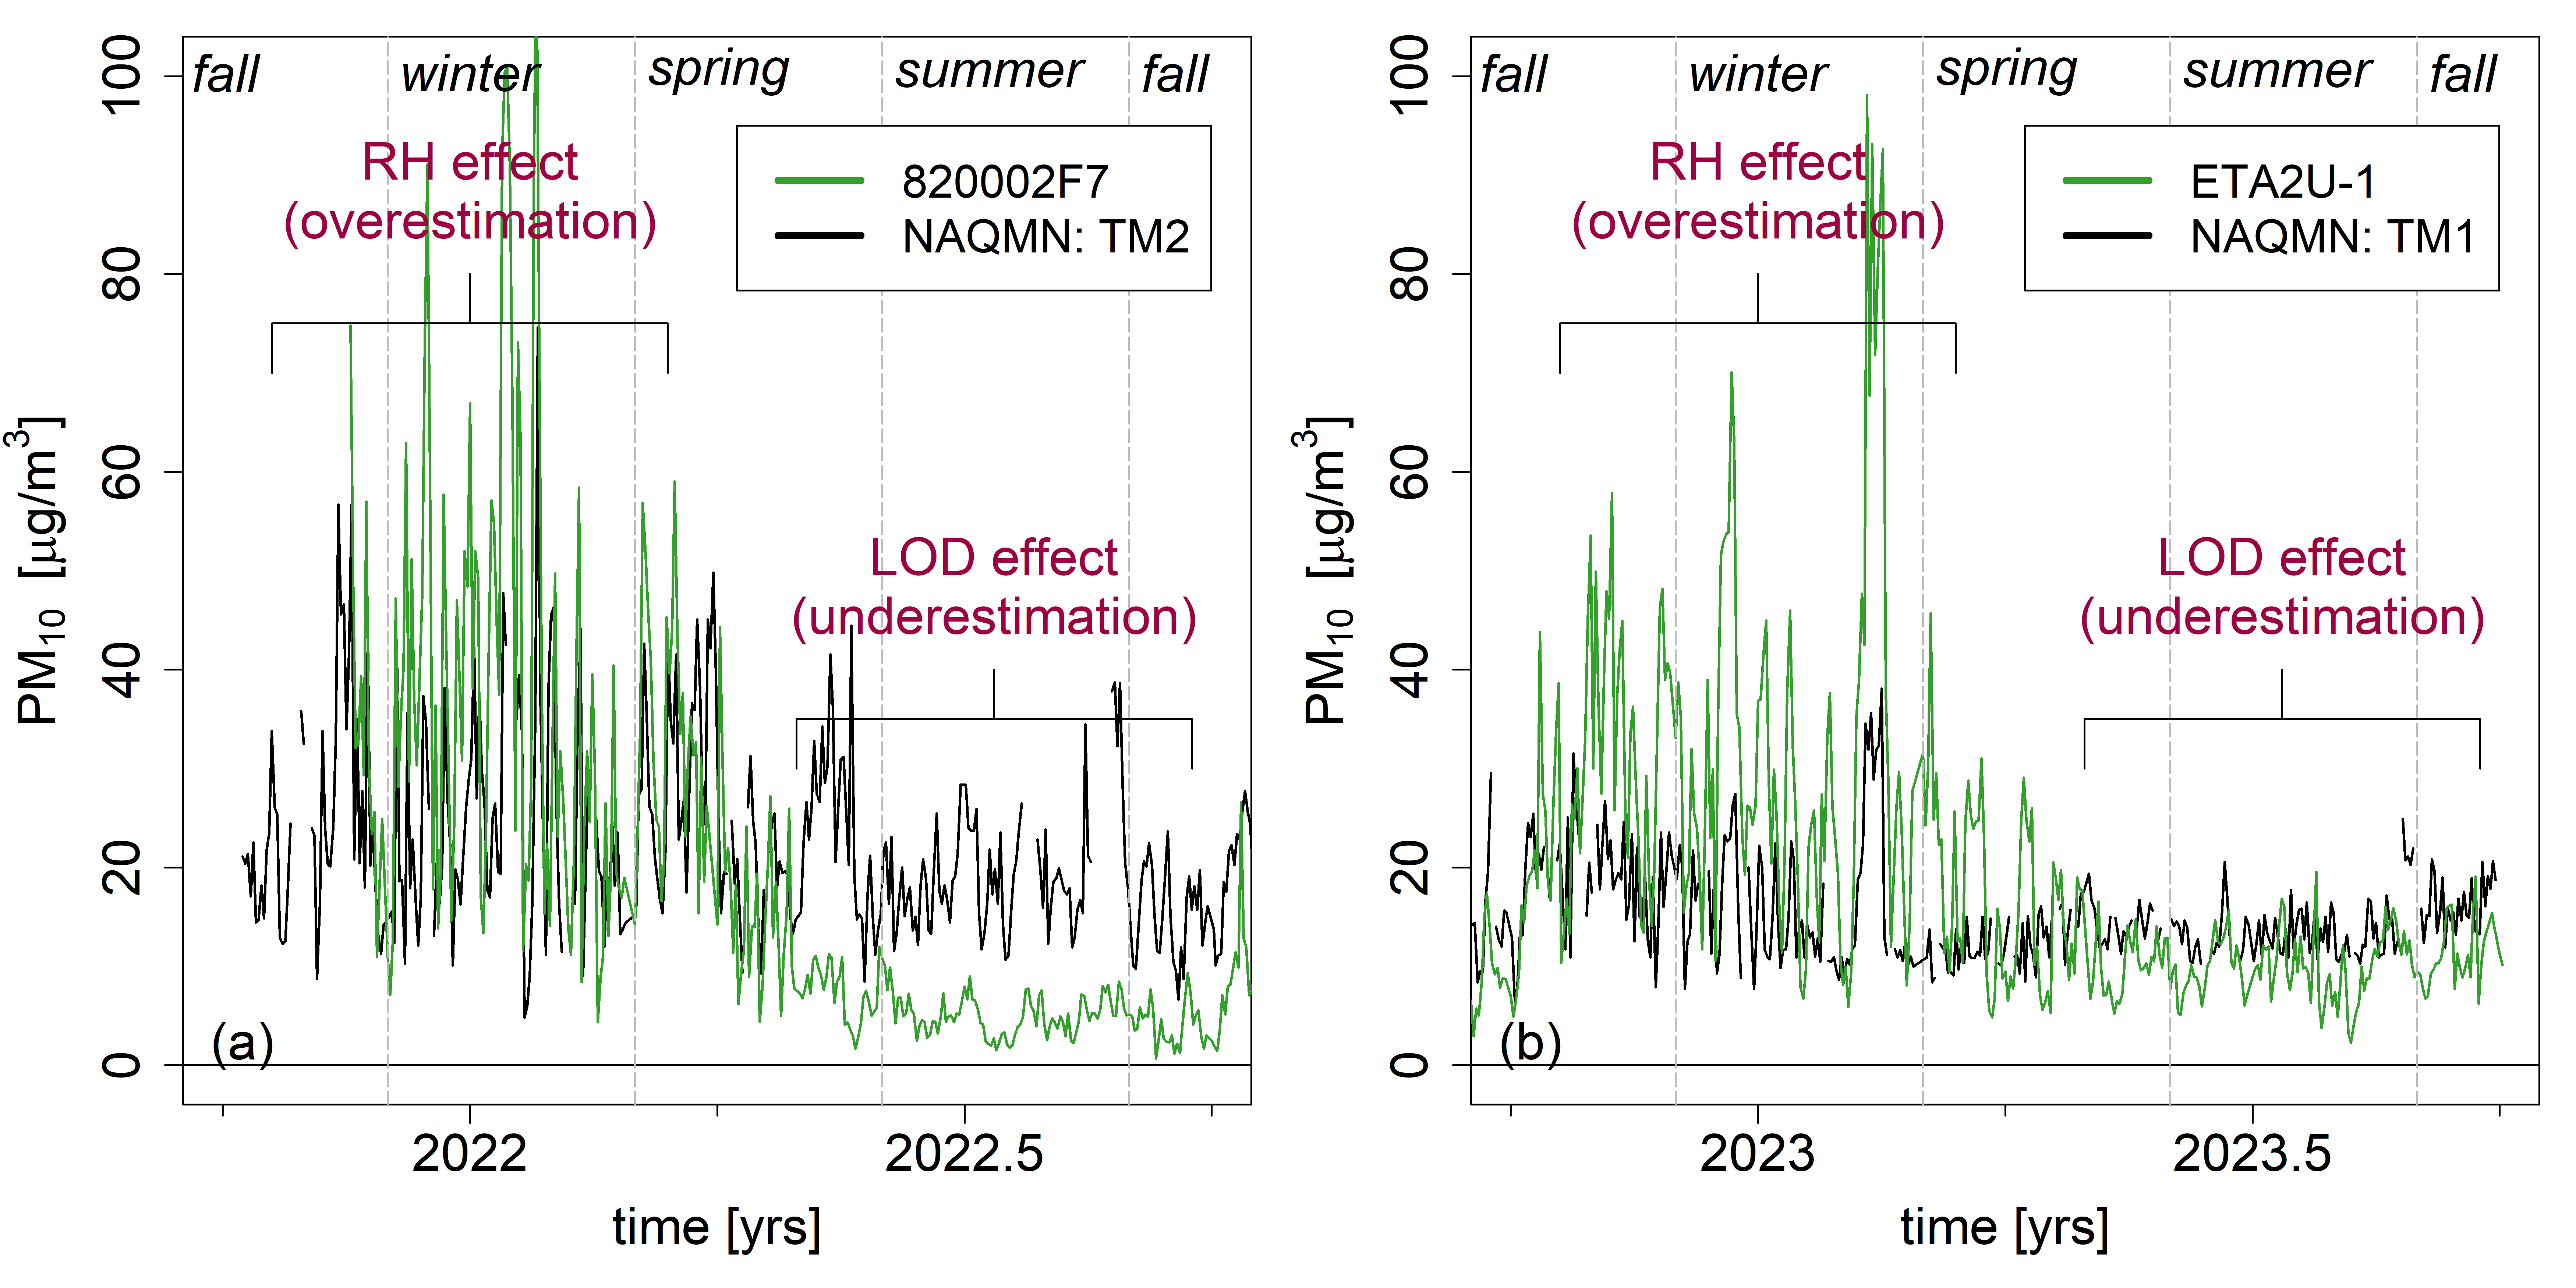
Low-cost air quality sensors (LCS) rely on light-scattering principles to assess particle number concentration and mass density (i.e. PM). These “nephelometer” type devices often have some bias in their measurements. During very high humidity conditions (winter in Romania), in particular, the PM values are amplified due to absorption of water vapor by the aerosol particles. For negative health impacts only the dry mass of these aerosols counts. In turn, during very dry periods (summer in Romania), the LCS underestimate the actual PM value. This is because nephelometers cannot reliably detect very small particles, which are more common in dry periods. Examples of LCS vs. reference data are shown in Fig. 2.
If reference-grade data is available, the accuracy of these measurements can be optimized or calibrated using corrections that depend on temperature, humidity and other parameters. In Romania, the National Environmental Protection Agency (ANPM) provides the data from the stations of their National Air Quality Monitoring Network (RNMCA) publicly at https://www.calitateaer.ro/. If an LCS and RNMCA station are located closely to each other, the RNMCA data can be used to assess and calibrate the LCS data.
The accuracy of uRADMonitor devices
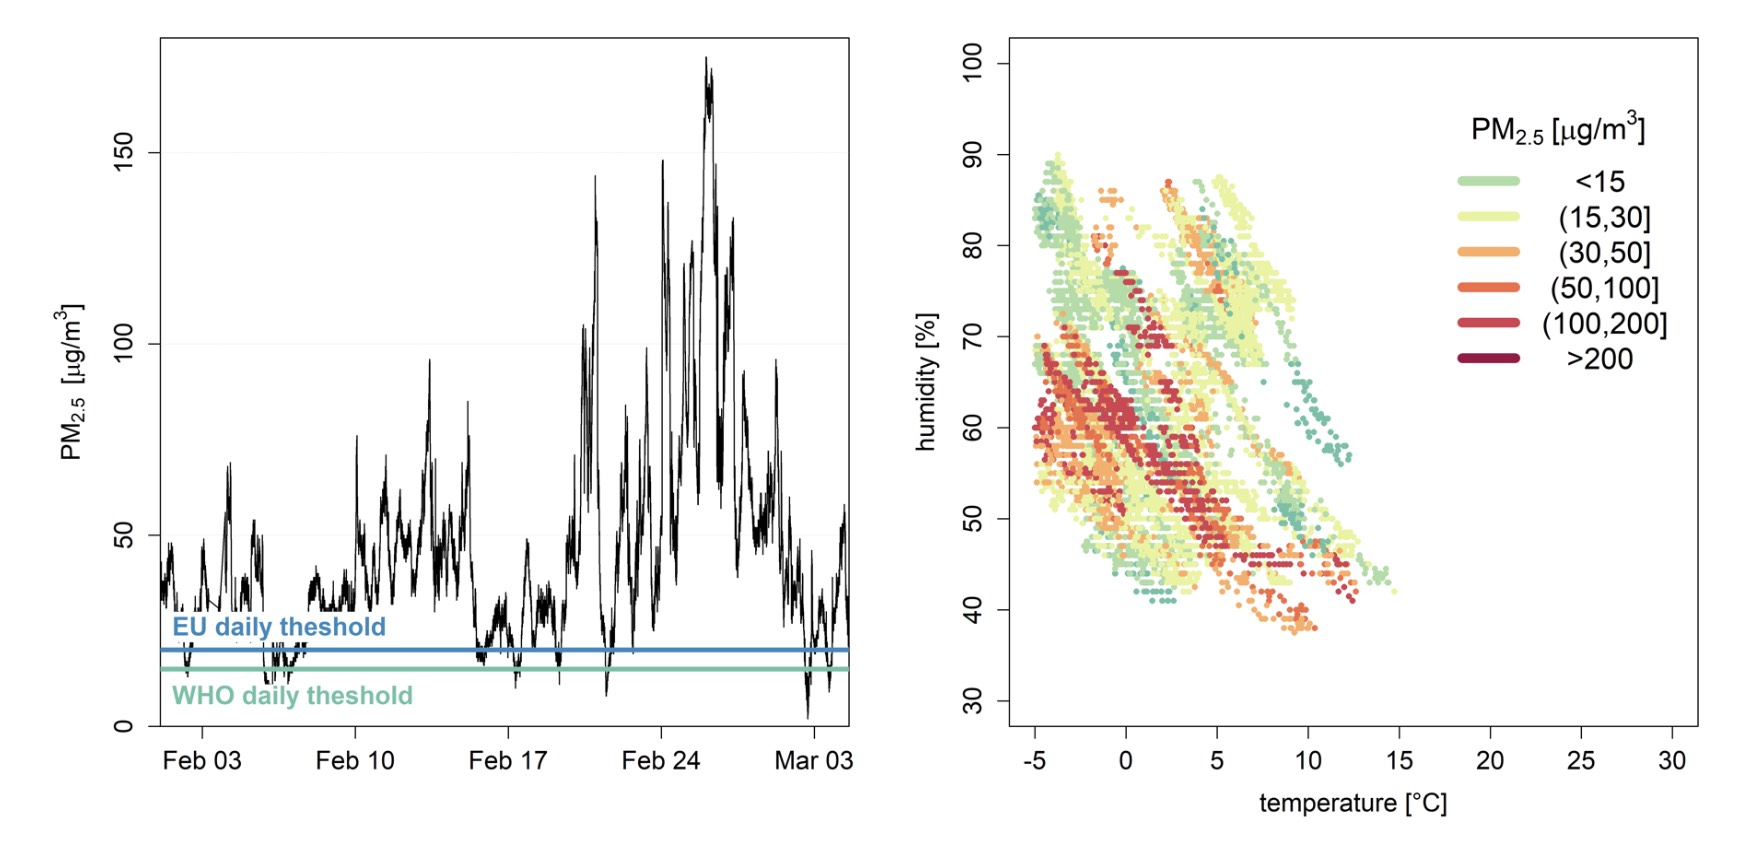
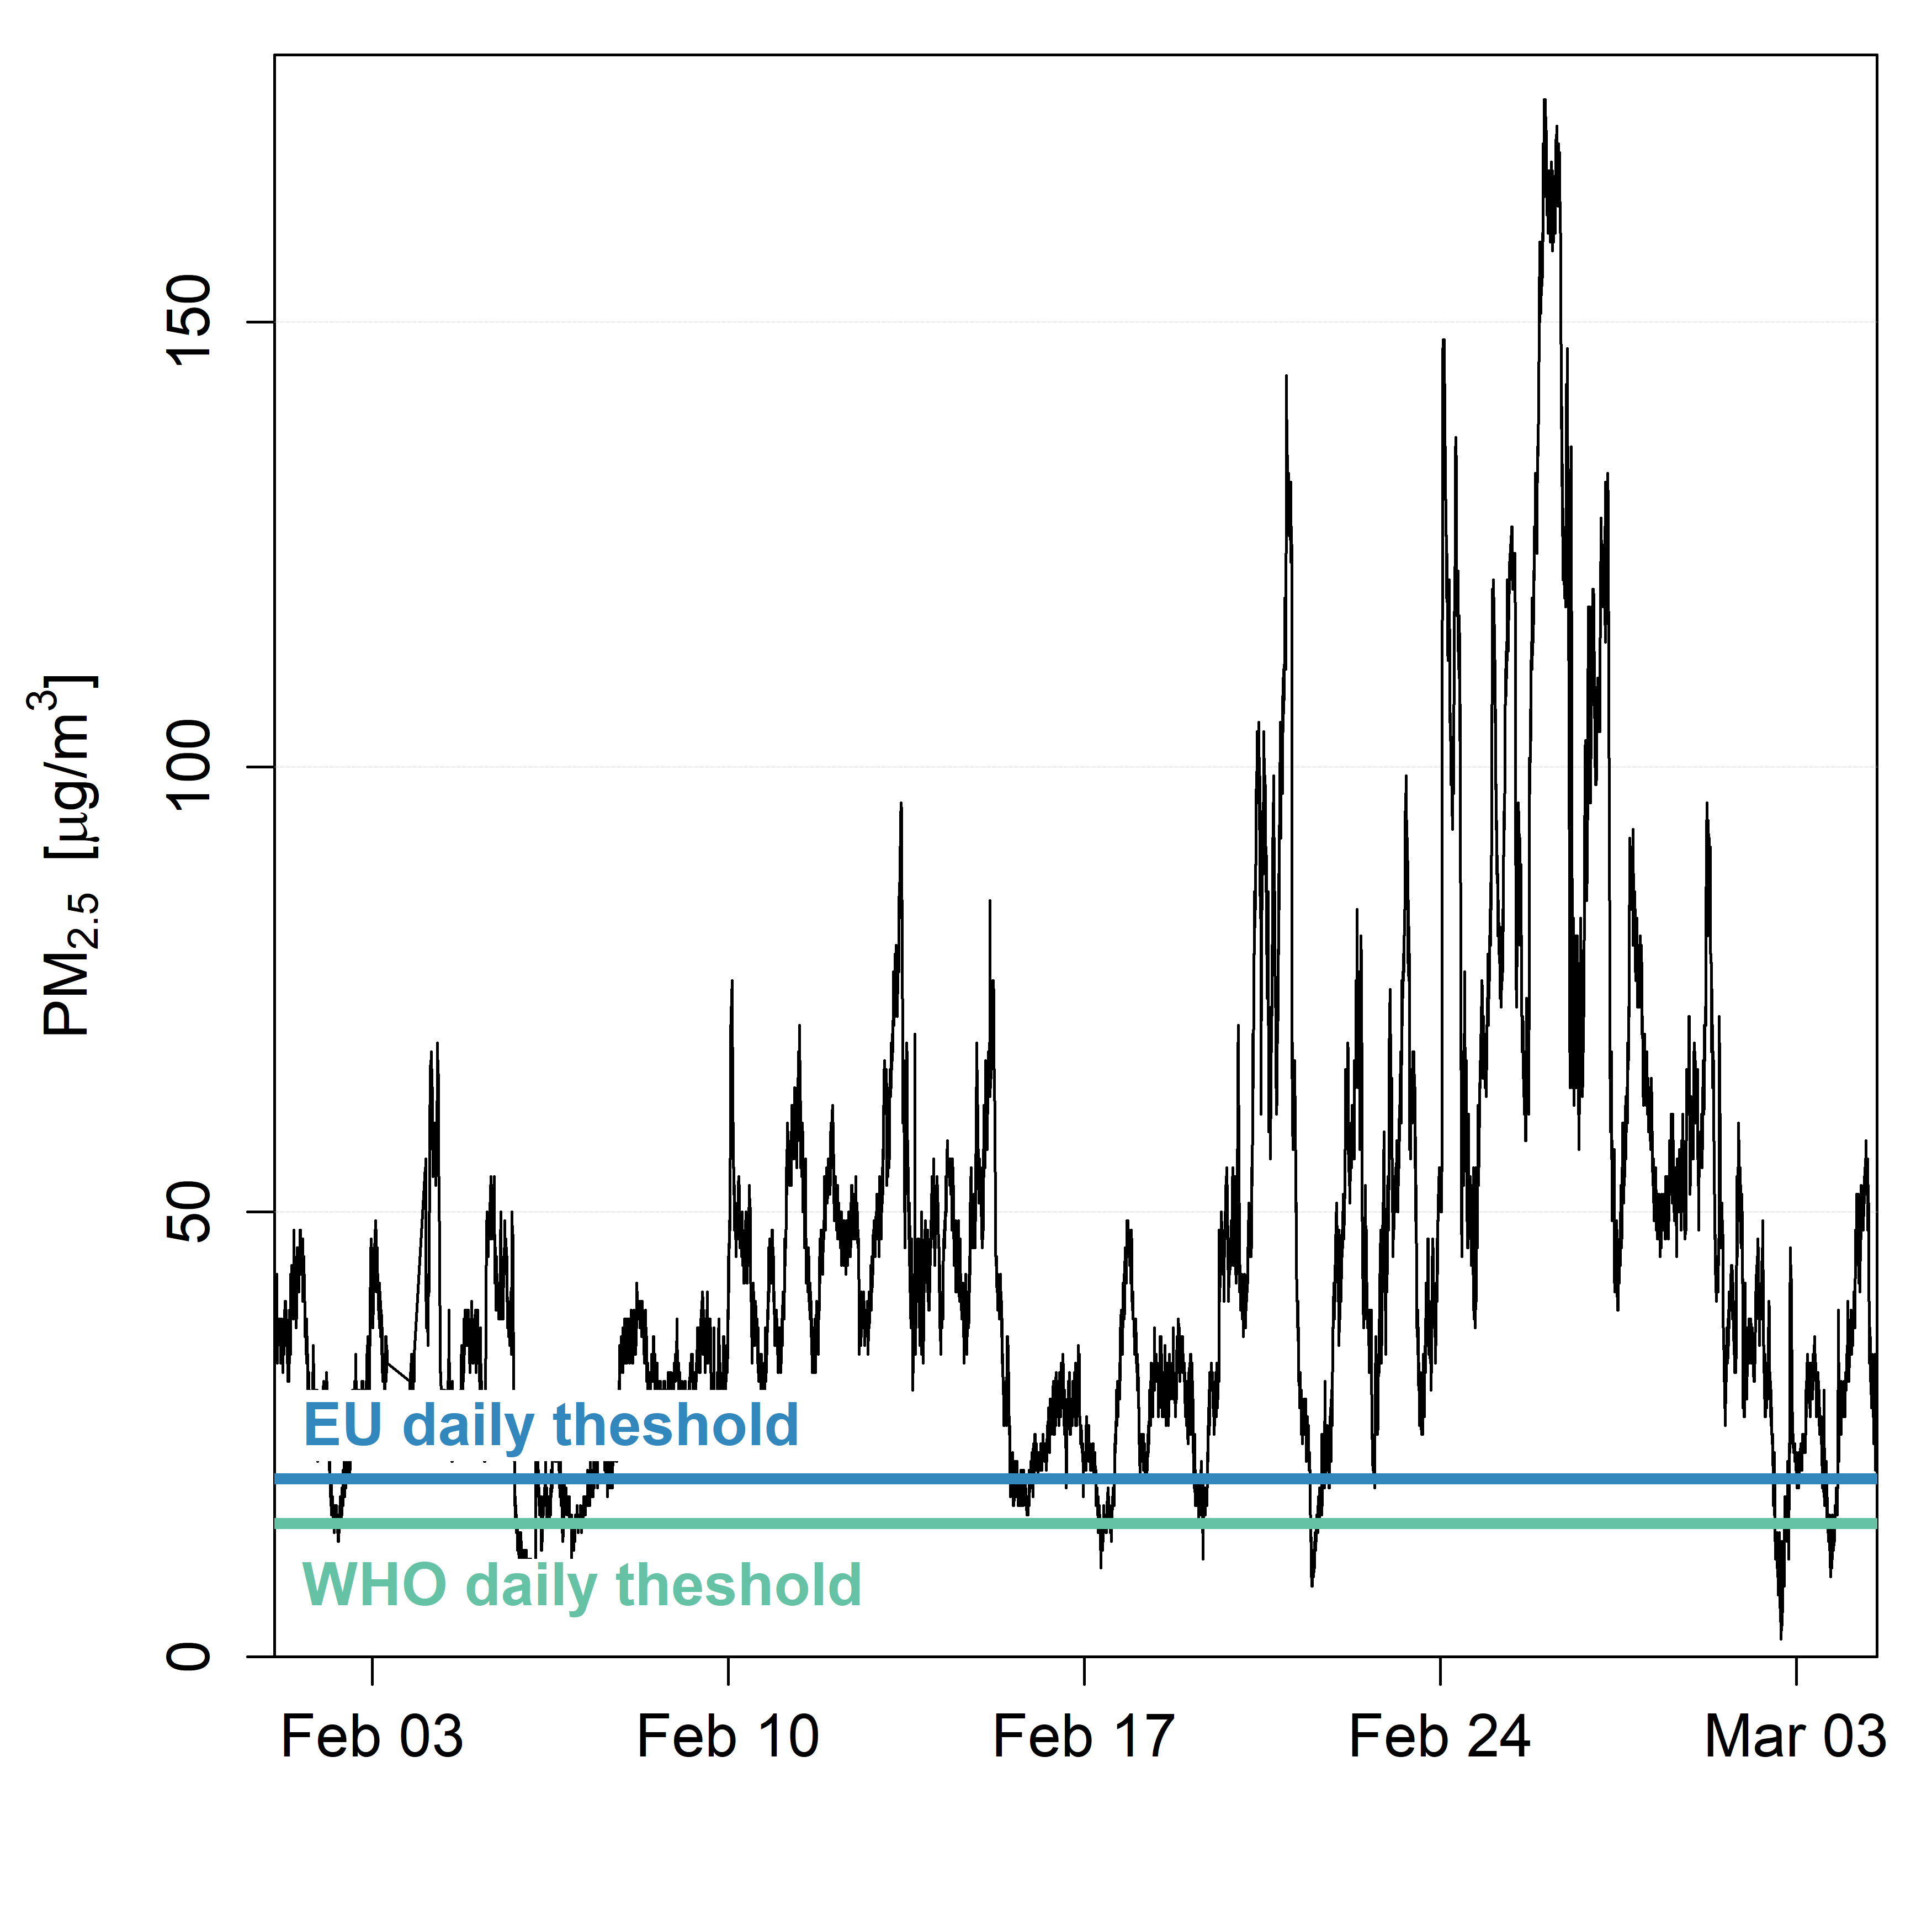
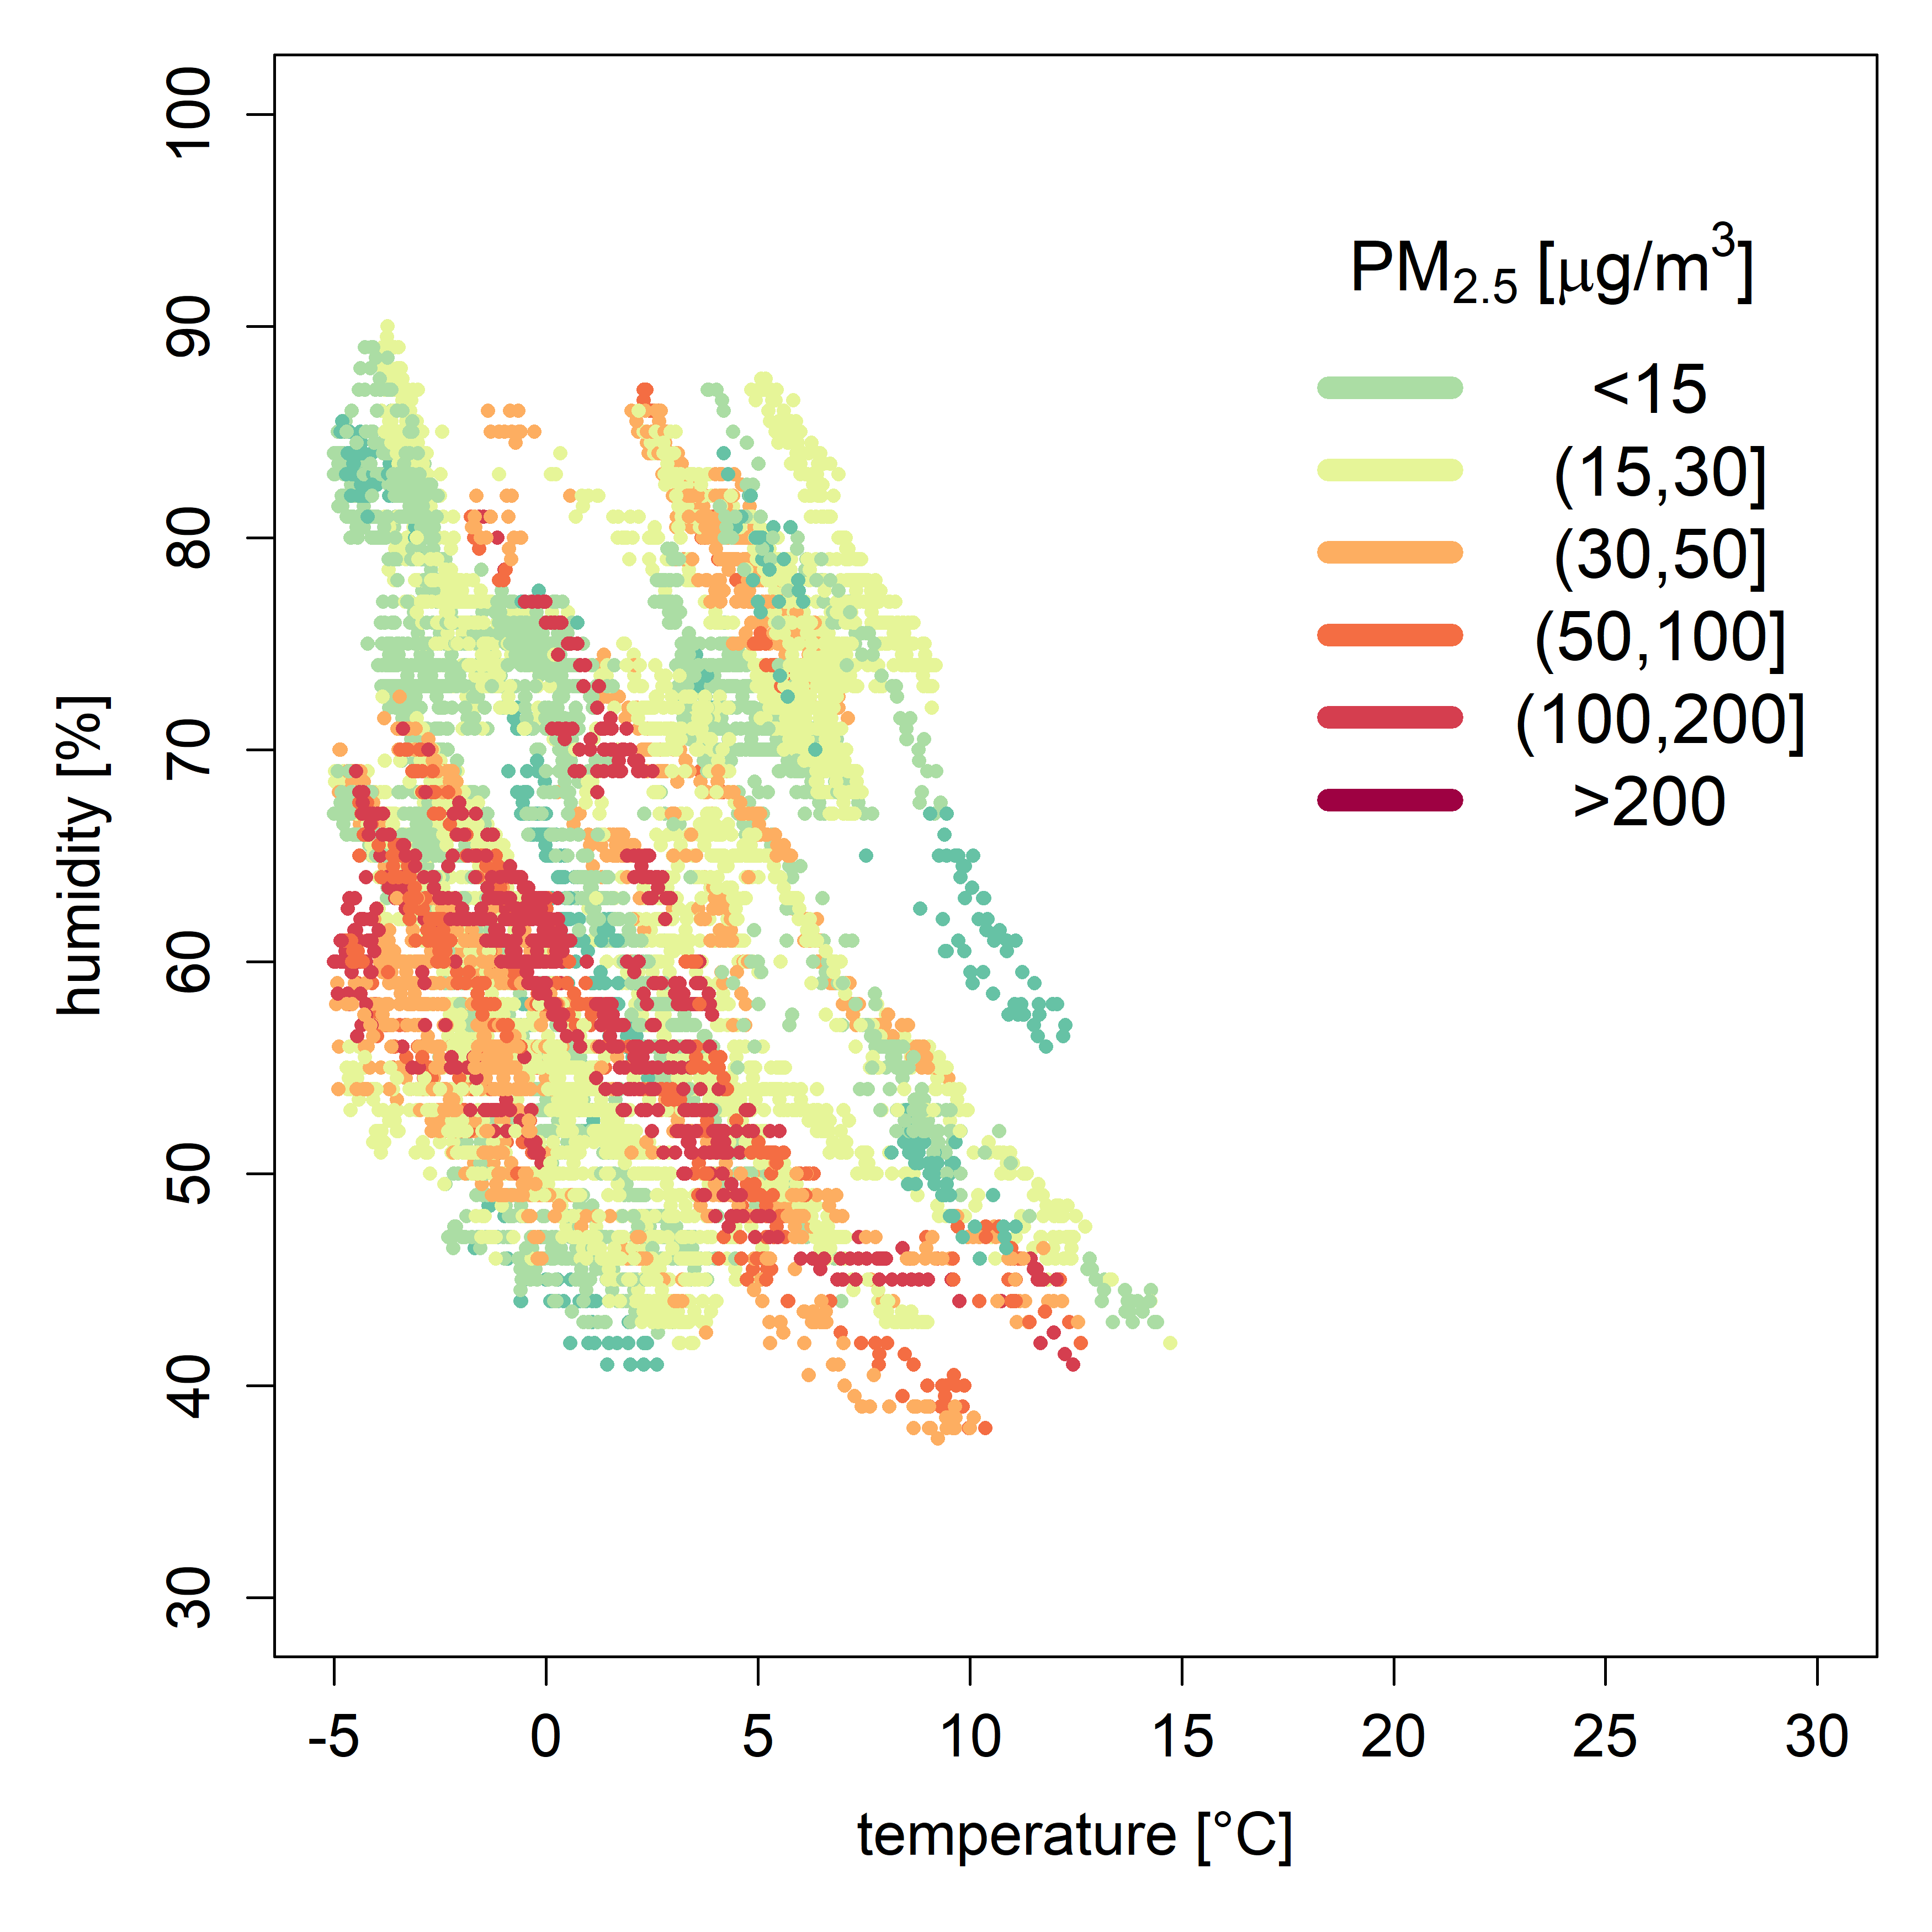
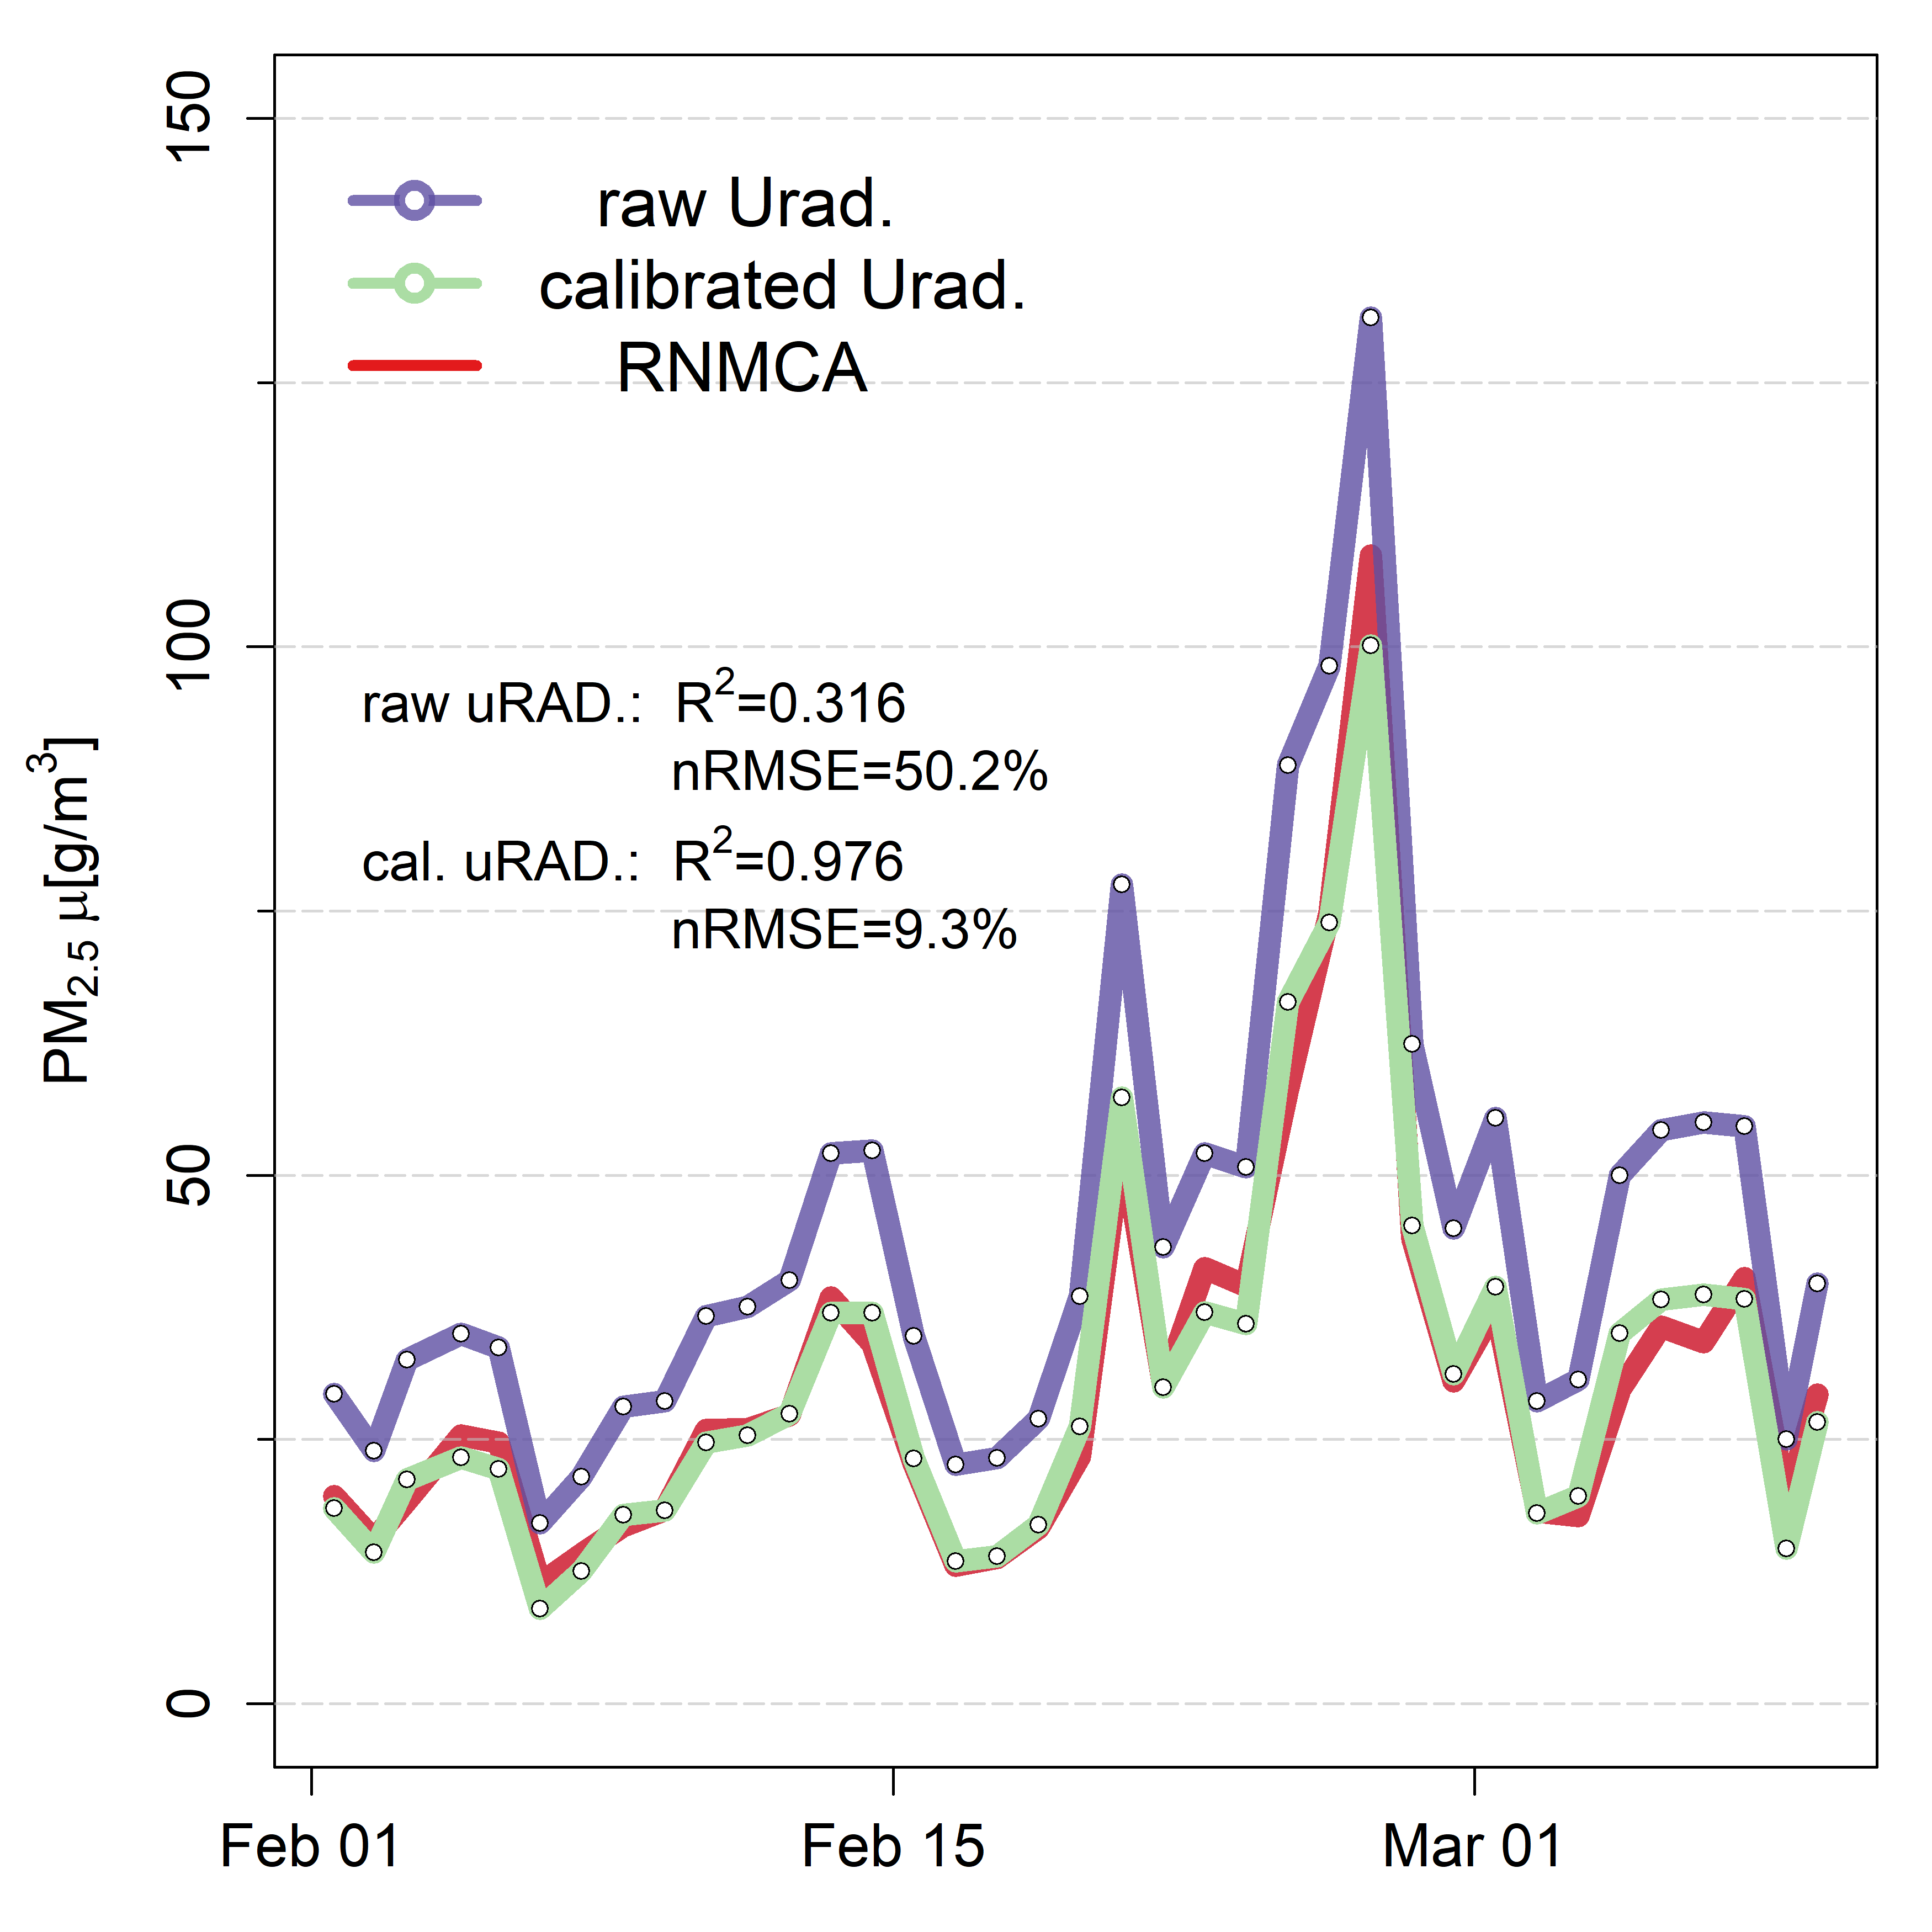
Figure 3 compares the data from an uRADMonitor SMOGGIE device (id:160000E0) and a closely located RNMCA station (id:B-20) placed in Bucharest. The RNMCA station uses a Derenda APM-2 mechanism which is considered of reference-equivalent grade by the ANPM (meaning one can consider this data “official”). Even without calibration, the uRADMonitor data is quite accurate. The Coefficient of Determination (R2) and Normalized Root Mean Squared Error (nRMSE) are commonly used in reporting the accuracy of PM sensors. The uRADMonitor data over the interval shown in Fig. 3 (01.02-07.03.2025) has R2 = 0.316 and nRMSE=50.2%, which is already quite good. However, there is clearly a systematic overestimation.
The accuracy can be further improved by employing a regression-based calibration. A simple model of the following form can be fitted on the data from Fig. 3:
PM2.5,cal = –3.91 + 0.799×PM2.5,Urad – 0.041×T2,
where T is the temperature measured with the uRADMonitor device. This brings the accuracy up to R2 = 0.976 and nRMSE = 9.3%, which is outstanding.
This simple analysis shows that uRADMonitor devices, with appropriate calibration, have the potential to provide very accurate air quality data that can be used to supplement the information of regulatory agency stations.
The importance of independent, low-cost sensors in assessing municipal air quality
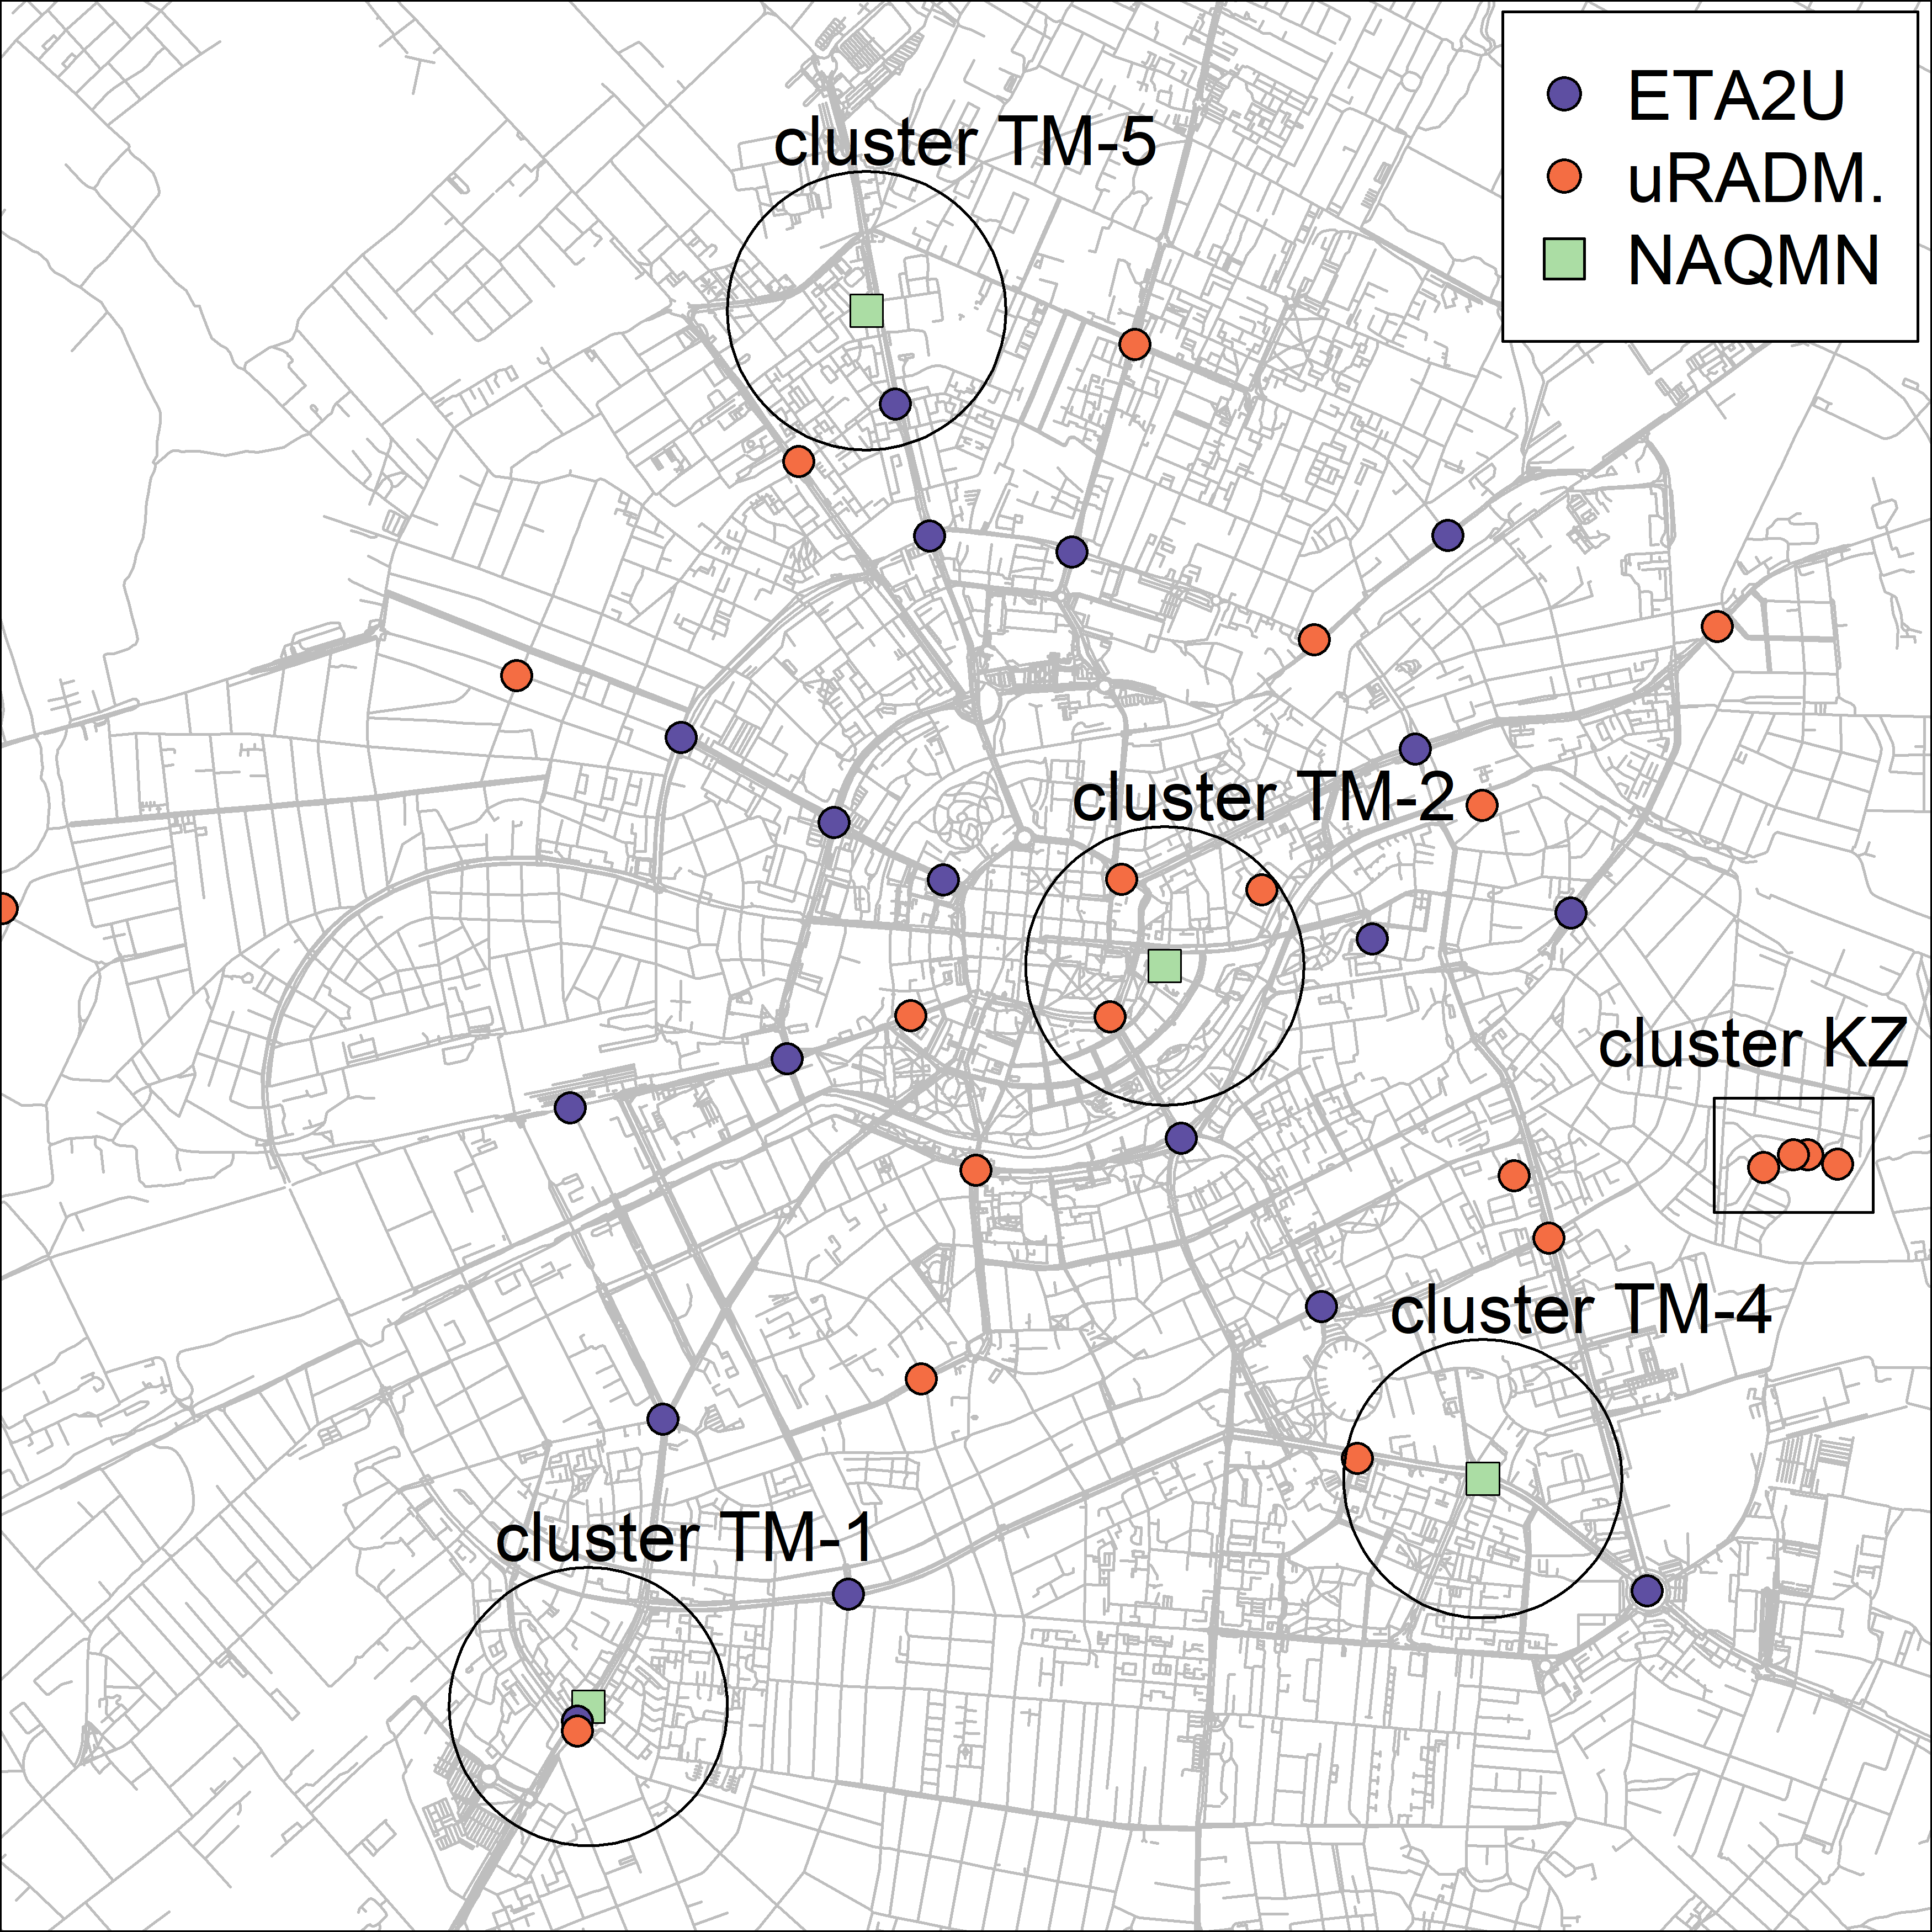
The great potential of LCS devices is to increase the spatial resolution of air quality information. This is essential in urban environments where air quality is determined by multiple highly localized sources (cars, factories, landfills etc.). Together with co-author Prof. S. Gautam, I published a paper analyzing the air quality in the city of Timisoara, Romania. The research is based on the data from the sensor network of the municipality, which partly consists of uRADMonitor devices. The calibrated LCS data was used to map the air quality in different parts of the city.
A notable result from our study is that the RNMCA stations miss the high PM values from the area around the KZ cluster of devices (see. Fig. 3). While the RNMCA stations record only a few violations of the daily EU PM2.5 and PM10 thresholds in general, the devices from the KZ cluster violate the threshold more than 50-100 times per year. Thus, the KZ cluster is a high PM source area and the personal exposure of citizens living in this part of the city is highly underestimated based on only the RNMCA data. This shows the importance of independent, high-density sensor networks in assessing air quality.
Accessing data using R through an API
R has become one of the most widely used programming languages in data-driven research fields. Data from sensors associated with a user on the uRADMonitor platform can be accessed through R via the uRADMonitor API, using the code below. Figure 4 shows a sample code for obtaining the ID list of the devices associated with your user. The user-id and user-key, which can be found in your dashboard, must be edited when implementing the code.

An R script with code to download and pre-process data from one of your devices and example code to generate the two panels of Fig. 1 can be downloaded from here. Explanatory comments for running the code are also included. The script requires R and RStudio to be installed and will prompt the user to install the R libraries httr and jsonlite. The code can be used under CC BY-NC license.
If anyone is interested in collaborating on this type of work please do reach out.
codemore code
~~~~