Real-Time Radiation Map
uRADMonitor is a global network of professional radiation detectors and air quality monitors, designed and built in Romania. Every reading on the map above comes from a physical device, not a model. Add yours.
All readings come from physical uRADMonitor stations installed in homes, schools, companies and public institutions, and the values on this page can be reused under CC BY 4.0 with attribution.
Find the right monitor for you
From a single room to a city-wide network.
Home & indoor
Track PM2.5, CO2 or radon in a room or apartment. Compact, plug-and-play.
Schools & public
Multi-parameter air quality for classrooms and public buildings, with a shareable live page.
Cities & outdoor
Rugged outdoor stations for municipal air-quality networks: Ethernet, WiFi, GSM or LoRaWAN.
Industrial & B2B
Toxic gas, ppb-level detection and LoRaWAN sensor fleets for industry and research.
Popular monitors
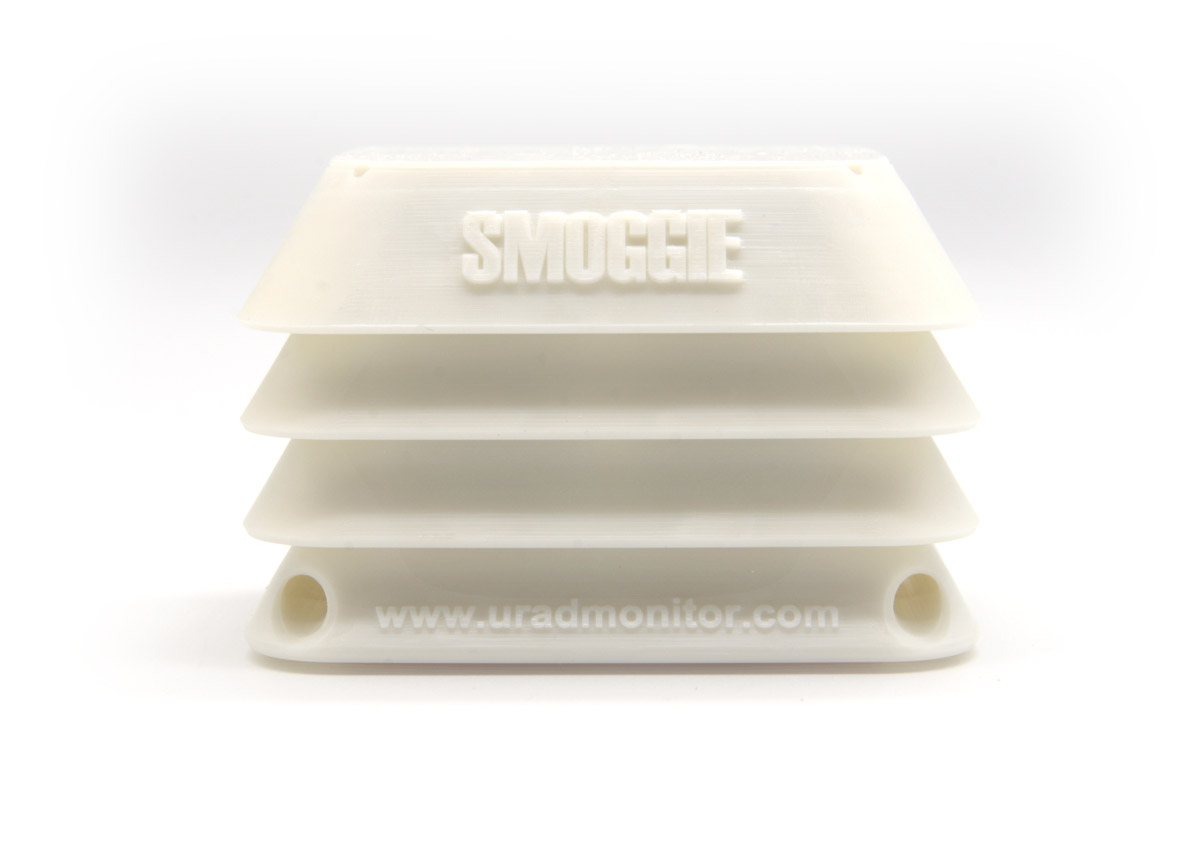
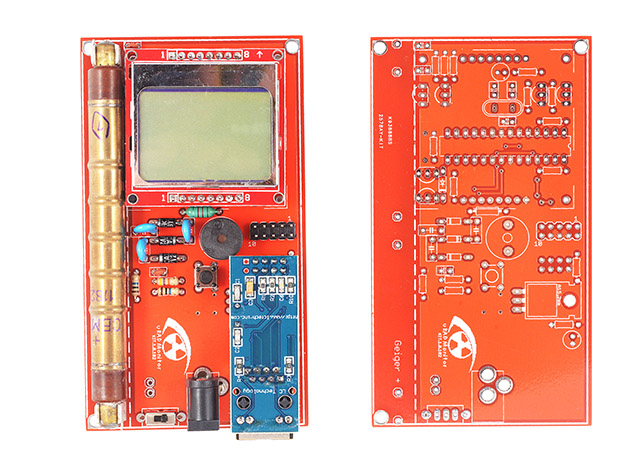
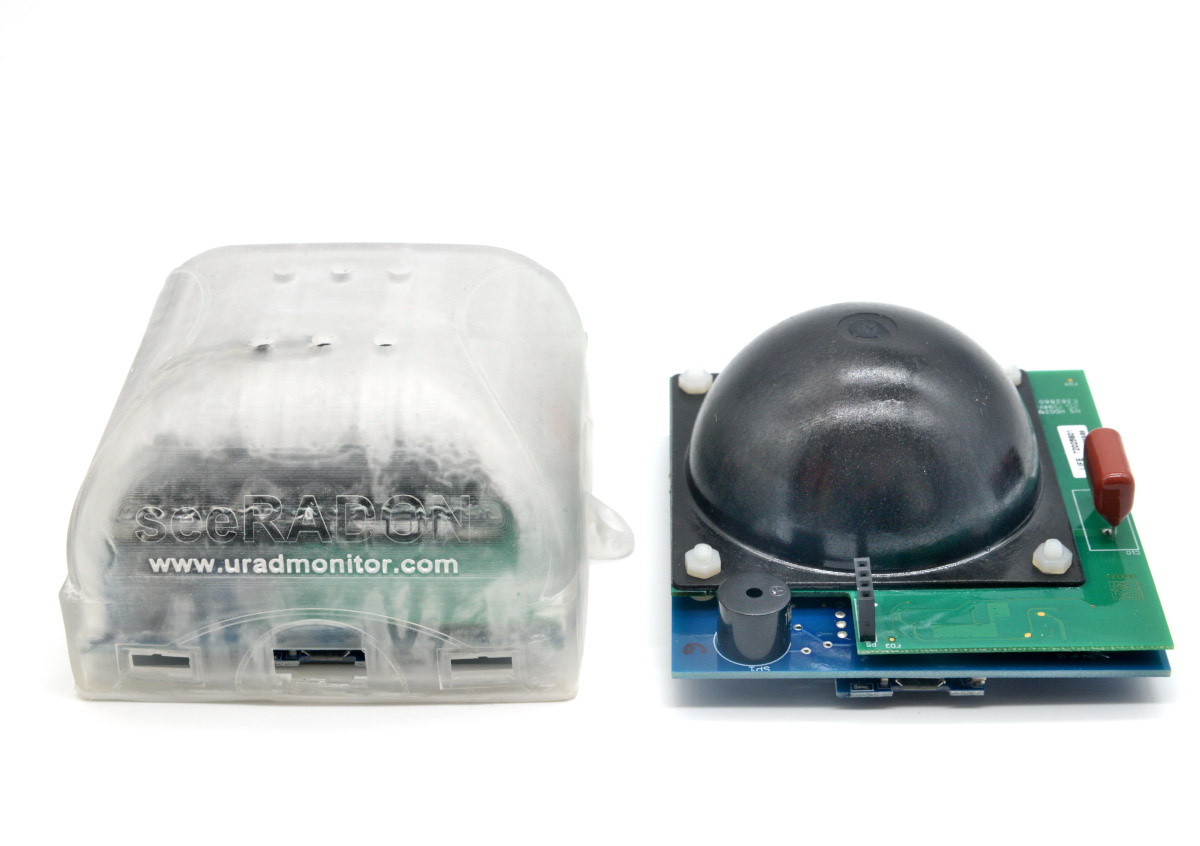
Plug-and-play. Your readings appear on the live map above.



Deploying a network?
Municipalities, universities and industry run uRADMonitor fleets with Ethernet, WiFi, GSM and LoRaWAN. Volume pricing, SDI-12 / LoRaWAN integration, and open data by default. Tell us about your project and we will scope it.
Frequently asked questions
What does this map show?
The map shows live readings from uRADMonitor sensors installed around the world. Depending on the model, a station measures ionizing radiation, particulate matter (PM1, PM2.5, PM10), CO2, VOC, noise, temperature, humidity and pressure. Click any sensor to see its current values and history.
What is a normal background radiation level?
Outdoor background radiation is typically between about 0.05 and 0.20 µSv/h. It varies with altitude, local geology and weather, and short increases during rain are normal. A reading that stays well above the local baseline is worth investigating.
What is the difference between CPM and µSv/h?
CPM (counts per minute) is the raw number of particles detected by the Geiger tube. µSv/h is the estimated dose rate. The conversion factor depends on the tube type, so CPM values from different detectors are not directly comparable, while µSv/h values are.
How often is the data updated?
Each station sends new measurements every few minutes. The map refreshes automatically, and the full history is available to owners in the dashboard and through the uRADMonitor API.
How can I add my own sensor to the map?
Every uRADMonitor device appears on the map once it is connected. You choose the location and whether it is public. See the available models on the Products page.