- This topic has 15 replies, 3 voices, and was last updated 8 years, 11 months ago by
uRADMonitor.
-
AuthorPosts
-
April 14, 2016 at 6:29 pm #2865
uRADMonitor
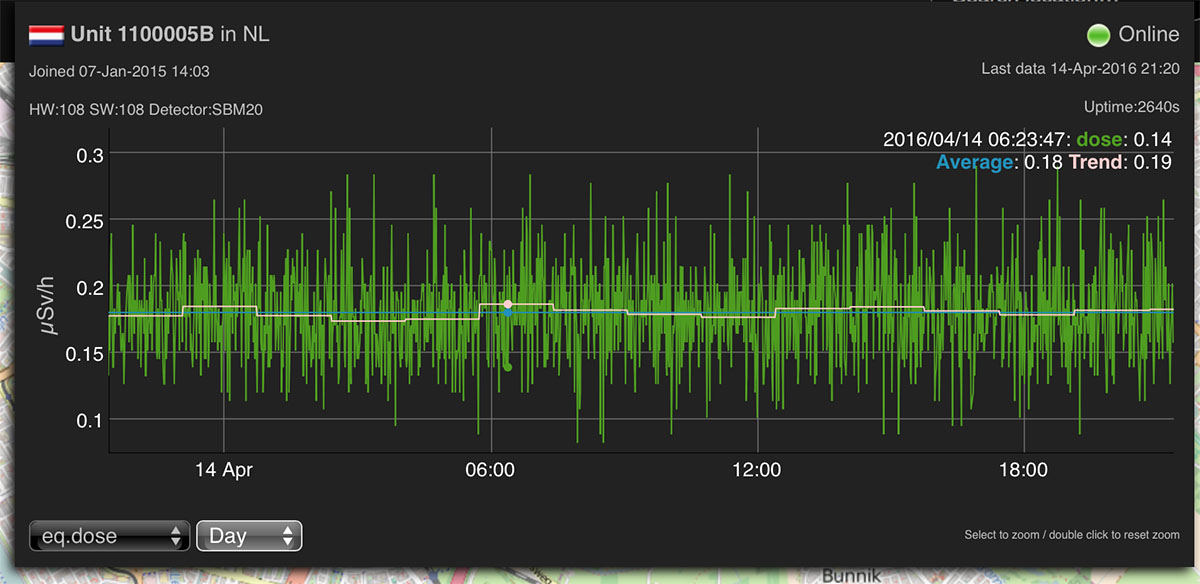
KeymasterA new parameter called “trend” was added to the chart information. It is a local average helping to understand longer term changes easier.
Attachments:
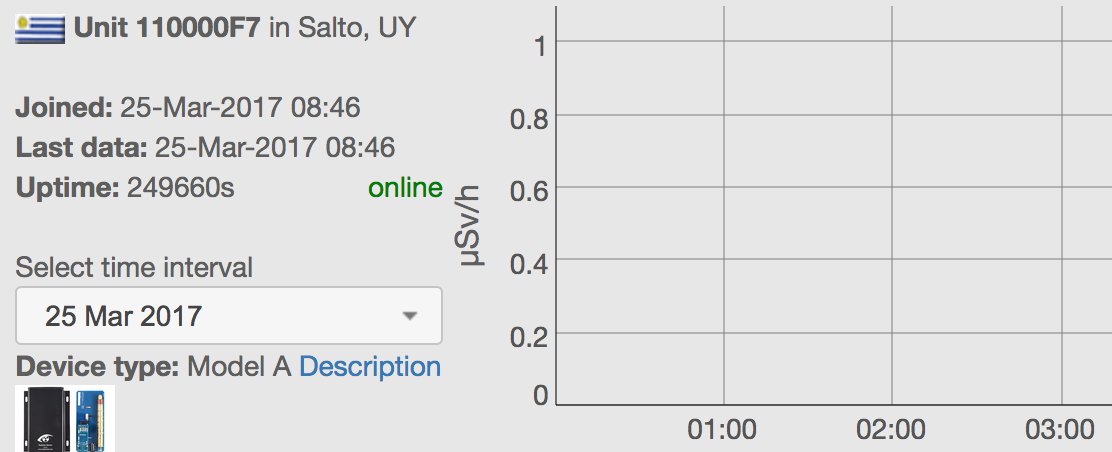
March 25, 2017 at 11:47 am #4142SaltoUYStation
ModeratorHi Radu, I see that in my chart the temperature data is on the graph, but the radiation data is not registering… doI need to do something with API to get the data on the chart? Thanks!
Attachments:
March 25, 2017 at 7:23 pm #4152Kurt
ParticipantSame problem. No Radiation data.
Also could you make the numbers bigger on the map. Very hard to read the number that displays on the map for a site.
March 26, 2017 at 11:35 am #4153ModeratorSometime after 2:12am (UTC) (11:12p UY time) the power disconnected – when I woke later I discovered this and reconnected the power. Likely a failure of a cat to maintain their enthusiasm. When I looked at my data in urad, the chart actually was graphing the radiation counts. After I reconnected the unit, the graphing ended.
March 27, 2017 at 1:01 pm #4159KeymasterHi Pia! I checked last week of data and seems to be continuous. Can you check that again?
There’s a little issue with the website now, sometimes the charts do not load. I will be fixing it soon.
March 27, 2017 at 2:16 pm #4169ModeratorNo worries and thanks so much! You are doing a great job. I imagine you have a lot to do. Too bad you can’t clone yourself, aye?
March 27, 2017 at 2:26 pm #4171ModeratorYes, the data is still posting continuously – it was a cat thing the other night. Need to build a special shelf they can’t access for the router and cables to tuck into.
March 27, 2017 at 9:33 pm #4200KeymasterClone myself, yes, that would be helpful. But don’t worry, I got you guys!
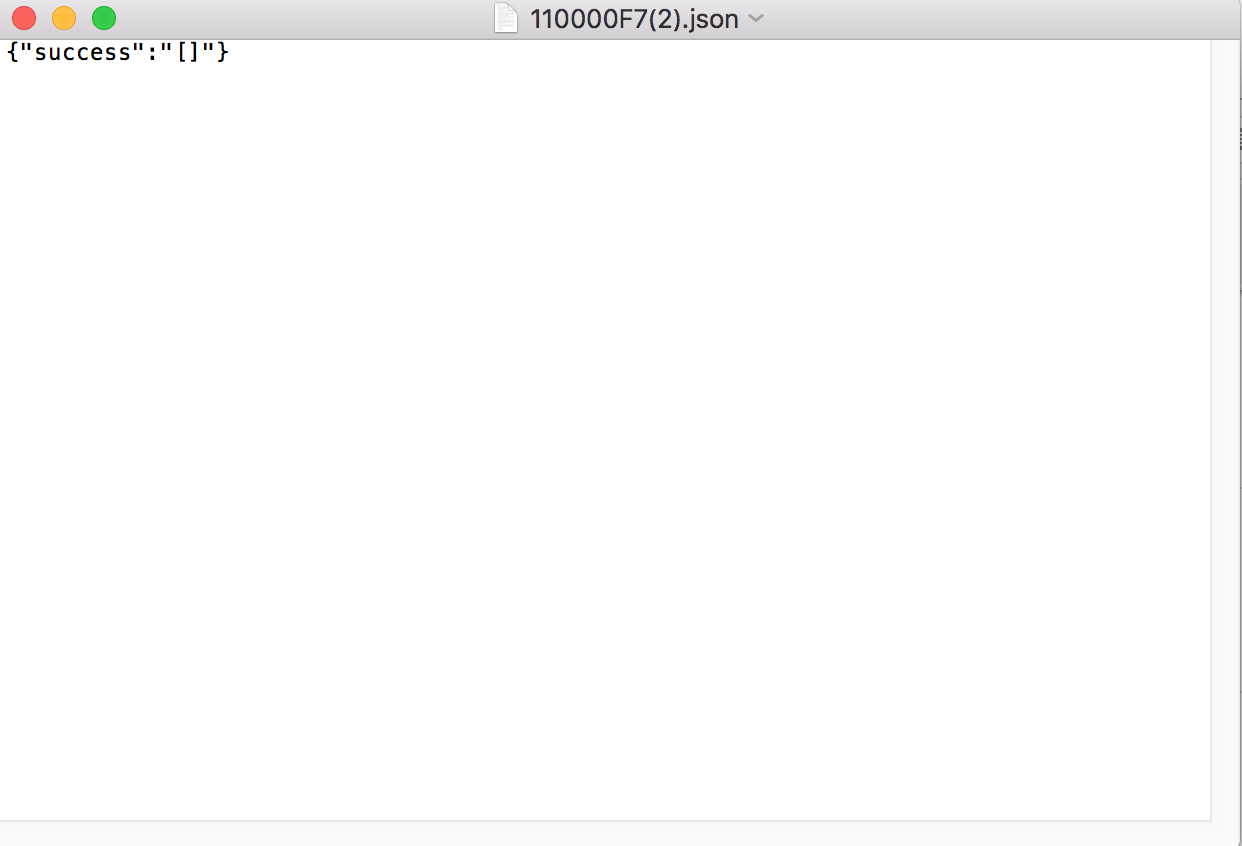
April 2, 2017 at 5:07 pm #4212ModeratorHello Radu, yesterday, or the day before, I noted that the temperature data wasn’t displayed in the online graph anymore and today graphing of radiation data isn’t occurring, either. And, when I download both JSON and CSV, no data downloads, blank docs. Just an FYI.
April 2, 2017 at 7:14 pm #4213KeymasterHi Pia,
Can you try again? I suspect this was something local?
Also if this happens again, please include a few snapshots. Might give me a clue on what’s happening.
Thanks!
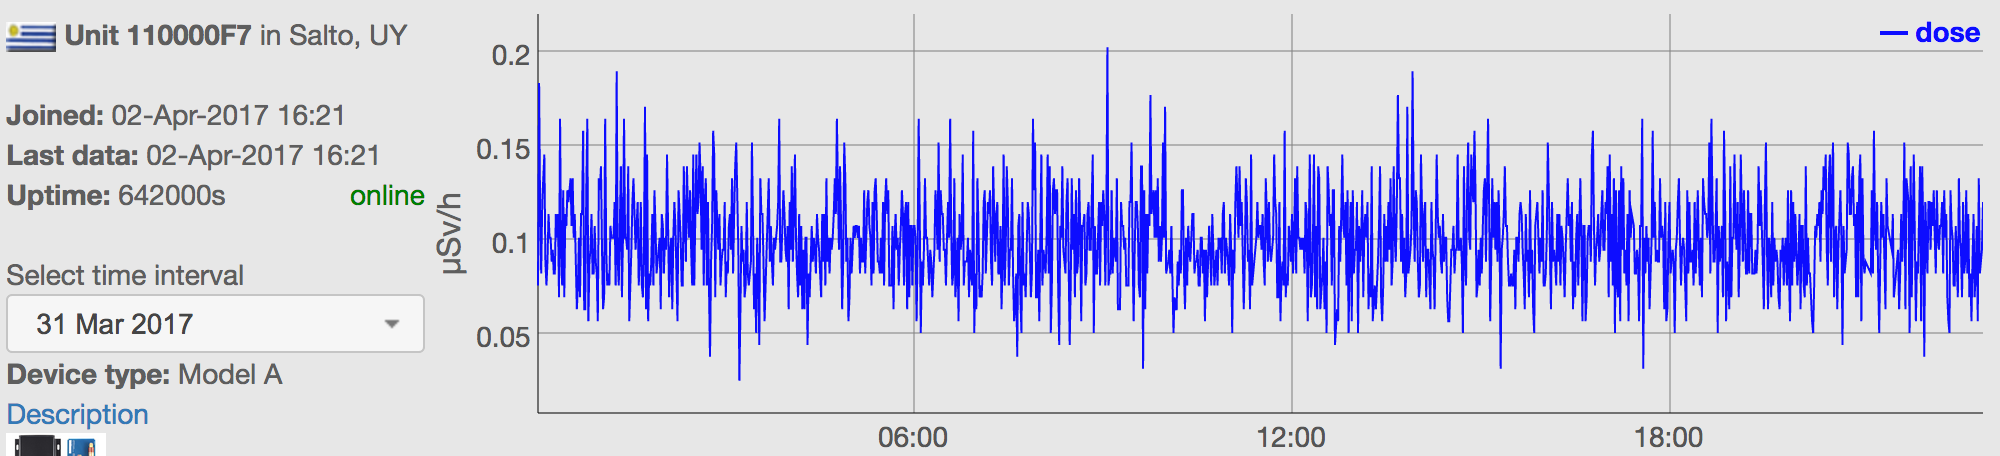
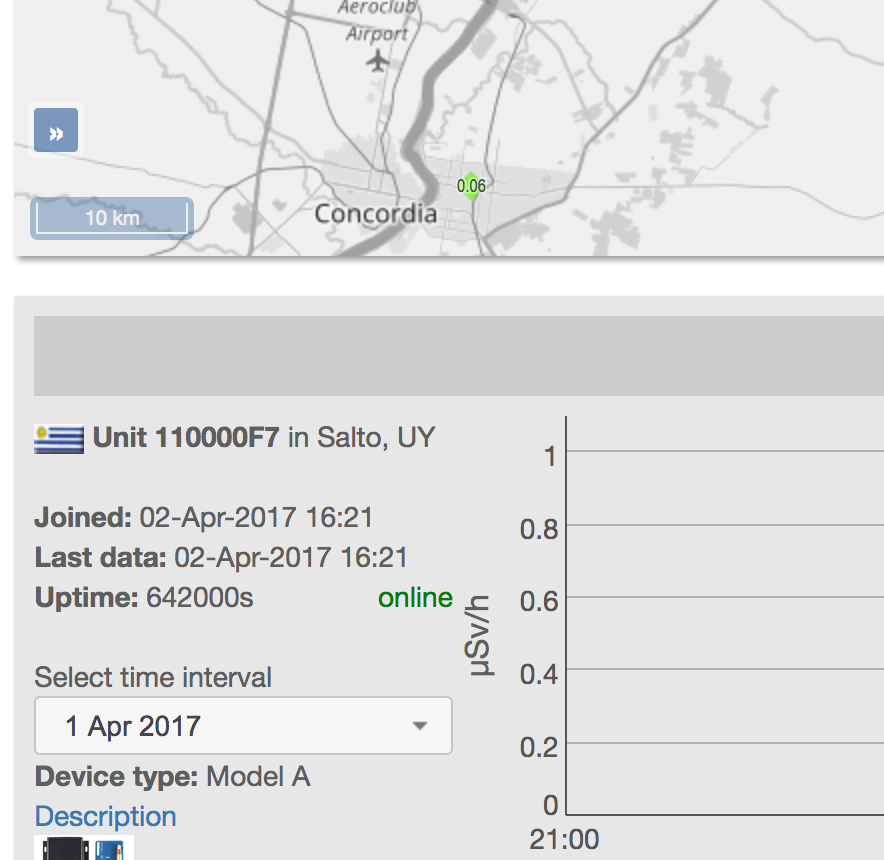
April 2, 2017 at 7:26 pm #4214ModeratorThanks, Radu. Here’s some relevant screenshots. I’ll reboot my router and unplug Model A, start fresh, see what happens. Graph for 2 April is empty like graph for 1 April.
April 2, 2017 at 7:35 pm #4219ModeratorGuess it takes a few minutes for the server to reflect that my system is back (map shows grey diamond). Though, my unit does display as online.
…
still wasn’t showing up- so, I unplugged the power cable from the energy source and plugged it into a different outlet, and, voila! The unit is now showing as a colored dot on the map again.
April 2, 2017 at 7:45 pm #4220ModeratorWill try downloading new JSON and CSV later.
April 3, 2017 at 11:20 am #4221ModeratorAs of 08:15 UY (11:15 UTC) still empty downloads and no data graphing…
April 11, 2017 at 9:56 am #4235ModeratorData downloads and graphing all functional now! Thank you, Radu!
-
AuthorPosts
- You must be logged in to reply to this topic.